Your clients don't just want automation—they want answers.
Every KNX installation generates thousands of data points daily. Temperature readings, energy consumption, occupancy patterns, equipment status—all flowing continuously through the building's management system. Yet most of this data disappears, invisible and unused.
The real value of building automation isn't in controlling devices. It's in the intelligence those devices generate.
Building owners and facility managers face constant pressure: reduce operational costs, prove sustainability progress, justify technology investments, and respond to issues before they escalate. They need more than a mobile app with switches and sliders. They need actionable insights that translate raw telemetry into informed decisions.
As an integrator, your role extends beyond installation. You are the bridge between complex building systems and the business outcomes your clients actually care about. When you can show a facility manager exactly where energy is being wasted, or demonstrate to a hotel owner how occupancy patterns affect revenue potential, you're no longer a vendor—you're a strategic partner.
All building systems converge into a single data platform—no separate pipelines, no complex processes.
Real-time status and measurements
Energy meters, HVAC controllers
Weather, energy prices, devices
IoT and third-party devices
Custom integration flows
Unified Building Intelligence
The data is already there—HyperVisu simply makes it visible and actionable.
All building data is stored locally on the HyperVisu Server. No cloud dependency, no third-party access, no recurring cloud fees.
Dashboards integrate seamlessly into the HyperVisu App, giving users access to analytics on mobile—locally at home or remotely from anywhere.
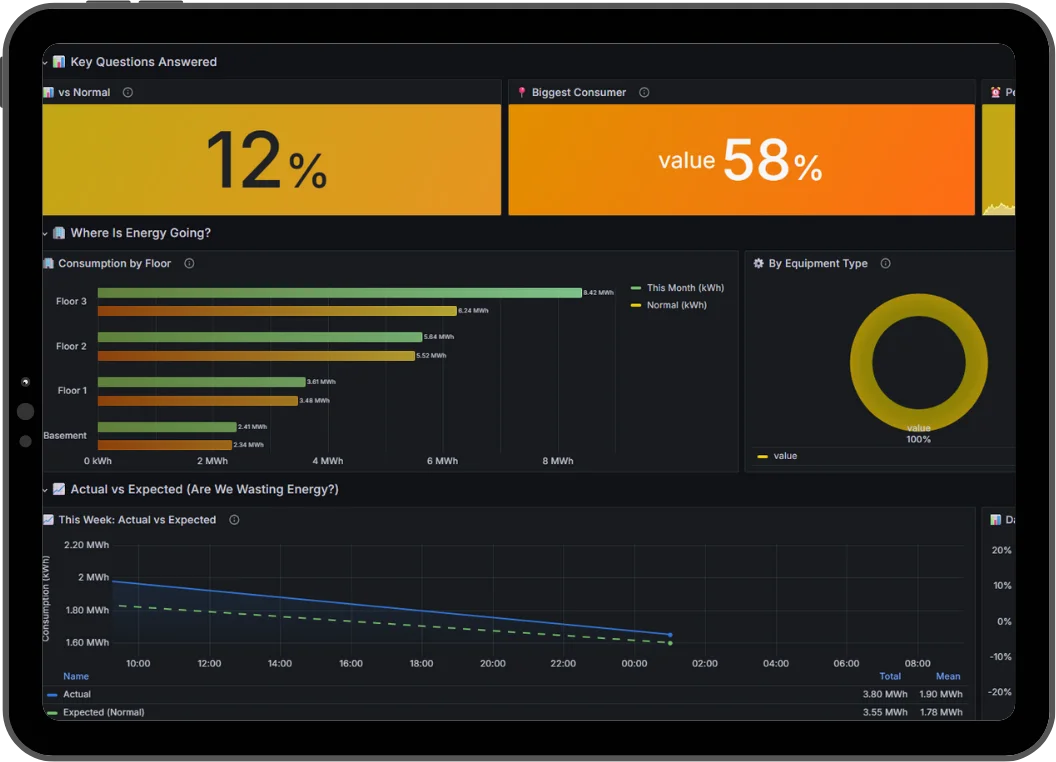
Grafana is the industry standard for operational dashboards. HyperVisu brings this enterprise-grade capability to every project.
Accelerate deployment with common use case dashboards
Customize dashboards to client requirements
Notify stakeholders before problems escalate
Support reporting and optimization planning
Dashboard capabilities transform your service offering
Pre-configured dashboard solutions for every building type. Browse the use cases below to see how data visualization creates value across building types and systems.
In a competitive market, data visualization is a powerful differentiator:
Win projects with comprehensive visualization demonstrations
Build long-term relationships as a strategic technology partner
Position your company as a building intelligence provider, not just an installer