Data Visualization with Grafana
HyperVisu includes a powerful integration with Grafana, an open-source analytics and visualization platform. With Grafana, you can create sophisticated energy monitoring dashboards, visualize historical data, and gain insights into your smart home's performance. This section explains how to access Grafana, create dashboards using HyperVisu data, and display these dashboards in the HyperVisu mobile application.
Accessing Grafana
Grafana is directly integrated with the InfluxDB database that stores all your historical data points.
Accessing Through a Web Browser
To access the Grafana interface from your HyperVisu server:
- Open a web browser and enter your HyperVisu server's IP address followed by /grafana
- Example: http://192.168.1.60/grafana
Authentication and User Management
- Grafana uses its own authentication system with the following default credentials:
- Username: admin
- Password: zeAAlyhQa5ej
- These credentials are separate from your HyperVisu administration login
- For security purposes, it's strongly recommended to change the default password after your first login
Creating Dashboards
Grafana allows you to create customized dashboards that present your data in meaningful ways. These dashboards can include various types of visualizations like graphs, gauges, and statistics panels.
Dashboard Basics
To create a new dashboard:
- After logging in to Grafana, click on the + icon in the sidebar
- Select Dashboard from the dropdown menu
- Click on Add new panel to begin adding visualizations to your dashboard
- Save your dashboard by clicking the save icon (disk symbol) in the top right corner and provide a descriptive name
Data Sources and Query Structure
HyperVisu automatically configures Grafana with the following data sources:
- InfluxDB: Pre-configured to connect to the built-in InfluxDB database
- This database contains all historical data from widgets that have logging enabled
- Data is stored in a bucket named "hypervisu"
- The data is organized using the following structure:
- _measurement: Your server's serial number (visible on the top left of the admin page)
- _field: The type of value (typically "value_float" for numeric values)
- category_name: The category assigned to the widget in HyperVisu
- widget_name: The name of the widget
- object_id: The unique ID of the widget's communication object
- To access this data, you'll write Flux queries that filter based on these fields
Additional Flux Query Examples
Daily Energy Consumption
from(bucket: "hypervisu")

 | > range(start: -24h)
 | > filter(fn: (r) => r["_measurement"] == "2cch674etf456")  // Replace with your server SN
 | > filter(fn: (r) => r["_field"] == "value_float")
 | > filter(fn: (r) => r["category_name"] == "Energie")
 | > filter(fn: (r) => r["widget_name"] == "Consommation")
 | > difference()
 | > sum()
Maximum Temperature Over the Past Week
from(bucket: "hypervisu")

 | > range(start: -7d)
 | > filter(fn: (r) => r["_measurement"] == "2cch674etf456")  // Replace with your server SN
 | > filter(fn: (r) => r["_field"] == "value_float")
 | > filter(fn: (r) => r["category_name"] == "Climate")
 | > filter(fn: (r) => r["widget_name"] == "Température")
 | > max()
Average Hourly Power Usage (for Pattern Analysis)
from(bucket: "hypervisu")

 | > range(start: -7d)
 | > filter(fn: (r) => r["_measurement"] == "2cch674etf456")  // Replace with your server SN
 | > filter(fn: (r) => r["_field"] == "value_float")
 | > filter(fn: (r) => r["category_name"] == "Energie")
 | > filter(fn: (r) => r["widget_name"] == "Puissance Active")
 | > aggregateWindow(every: 1h, fn: mean, createEmpty: false)
 | > duplicate(column: "_stop", as: "hour")
 | > timeShift(duration: -1h, columns: ["hour"])
 | > hourSelection(start: 0, stop: 23)
 | > group(columns: ["hour"])
 | > mean()
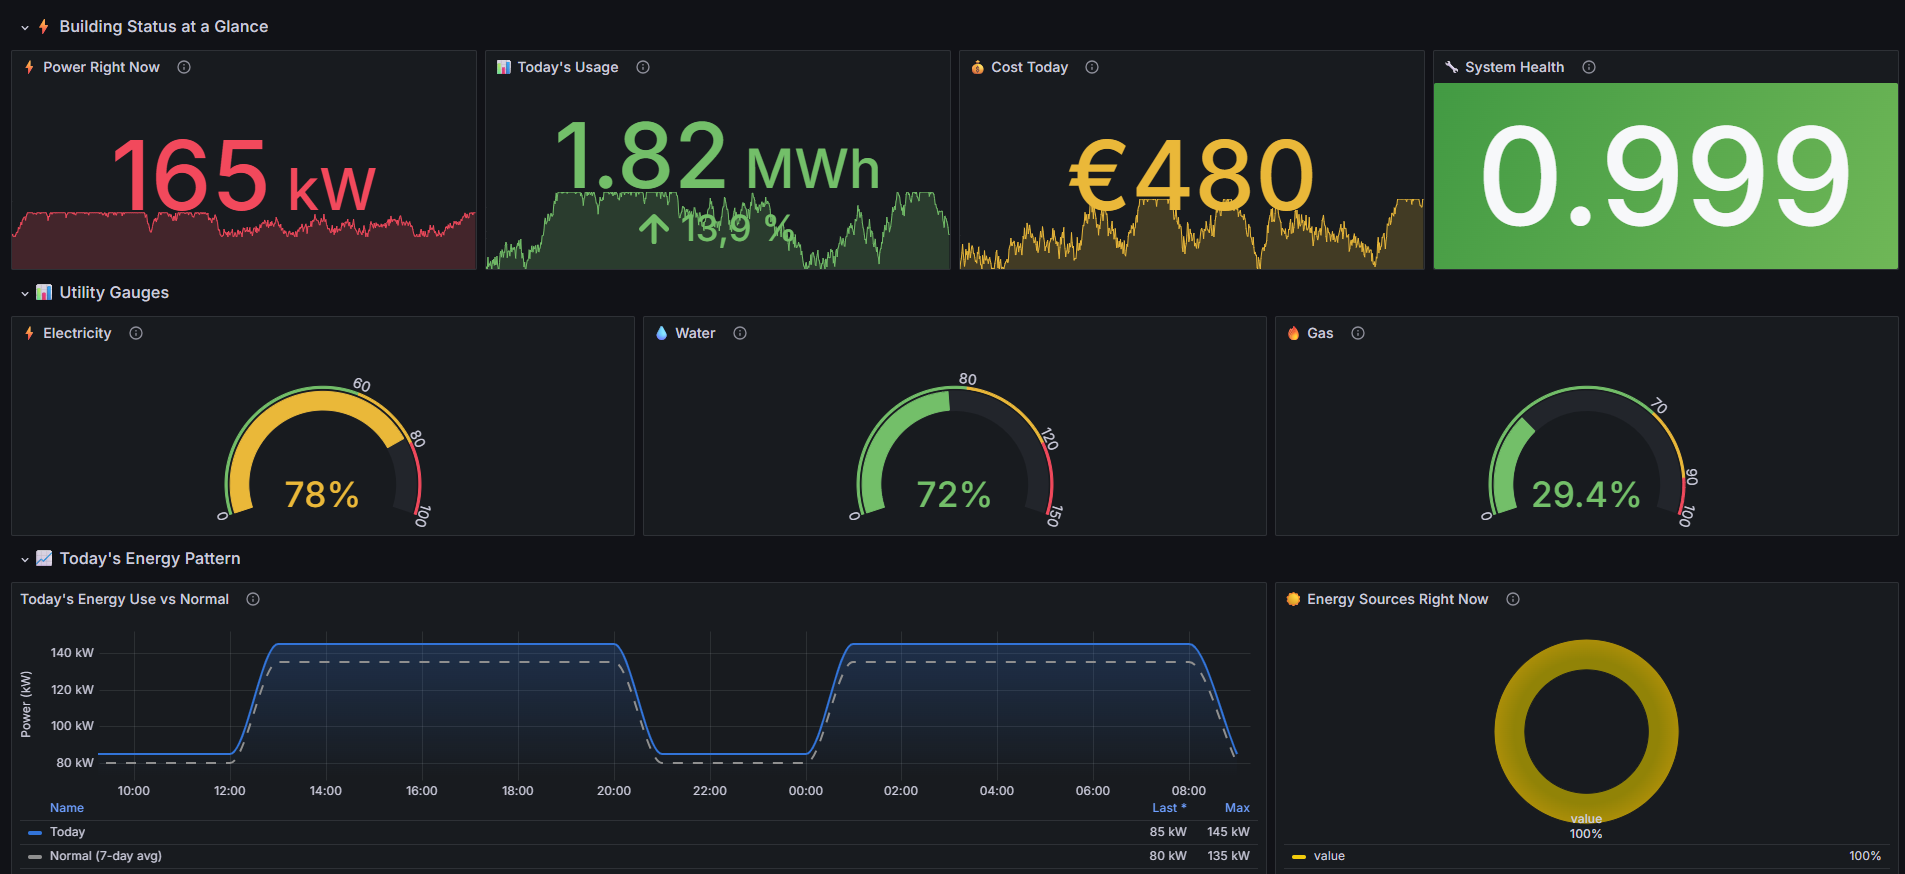
Creating Energy Monitoring Panels
Energy monitoring is one of the most powerful applications of Grafana within HyperVisu. Here's how to create energy visualization panels:
- From your dashboard, click Add panel
- Select the visualization type that best suits your data (common choices include):
- Time series graph: For showing power consumption over time
- Gauge: For displaying current power usage
- Stat: For showing cumulative values like daily kWh
- Configure the panel with a query that pulls data from InfluxDB:
- Select InfluxDB as the data source
- Select Flux as the query language
- Use the query builder or write a Flux query to select your energy data
- Your query must reference your server's serial number as the measurement field
- The server serial number can be found at the top left of the administration page
- Filter data by category name, widget name, or object ID as needed
Example Flux Queries for Energy Monitoring
When creating panels, you'll need to write Flux queries to retrieve data from the HyperVisu InfluxDB database. Here are some examples:
Power Consumption Over Time (Time Series Graph)
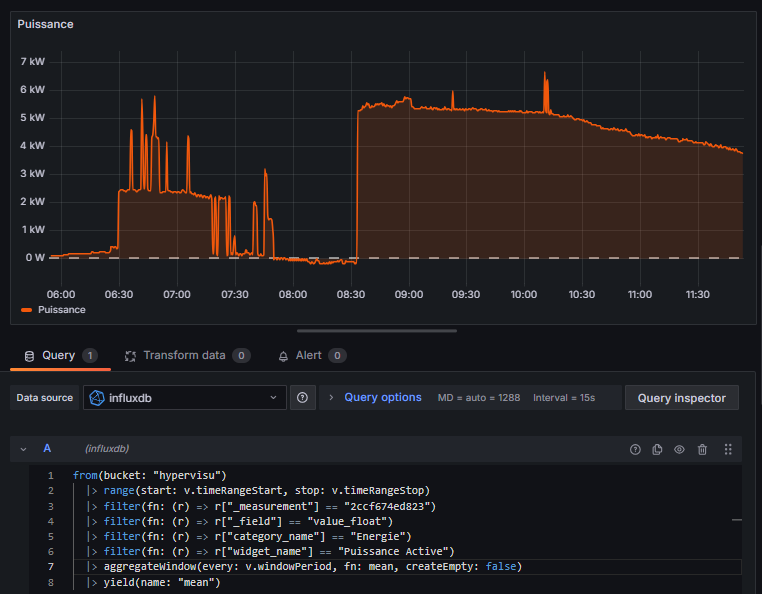
from(bucket: "hypervisu")

 | > range(start: v.timeRangeStart, stop: v.timeRangeStop)
 | > filter(fn: (r) => r["_measurement"] == "2cch674etf456")  // Replace with your server SN
 | > filter(fn: (r) => r["_field"] == "value_float")
 | > filter(fn: (r) => r["object_id"] == "123")  // Replace with actual object ID
 | > aggregateWindow(every: v.windowPeriod, fn: mean, createEmpty: false)
 | > yield(name: "mean")
Current Voltage Reading (Gauge or Stat)
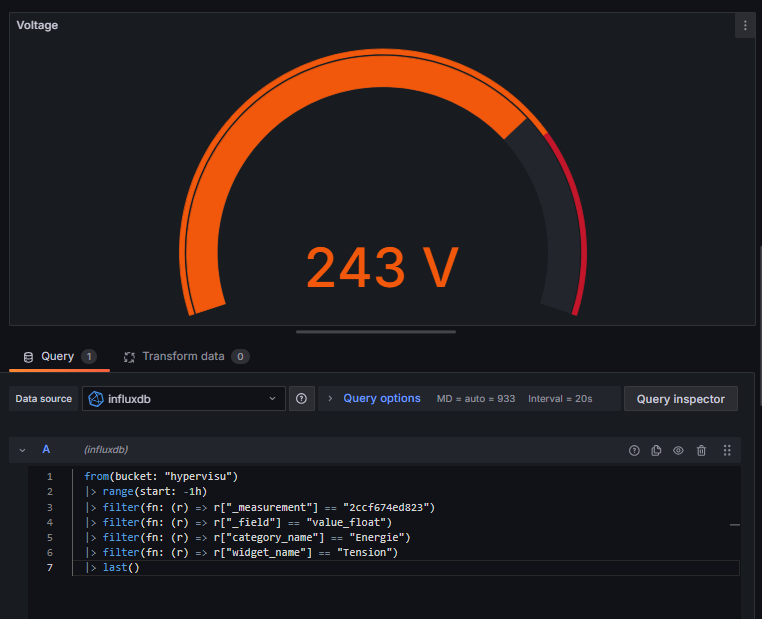
from(bucket: "hypervisu")

 | > range(start: -1h)
 | > filter(fn: (r) => r["_measurement"] == "2cch674etf456"")  // Replace with your server SN
 | > filter(fn: (r) => r["_field"] == "value_float")
 | > filter(fn: (r) => r["object_id"] == "123")  // Replace with actual object ID
 | > last()
Querying by Object ID
Each object stored in the HyperVisu database have a unique object ID, this object ID can be found from the object modal in the devices edition page of the HyperVisu administration (or in the "Import/Export" section of the admin page, in the "communication objects" table):
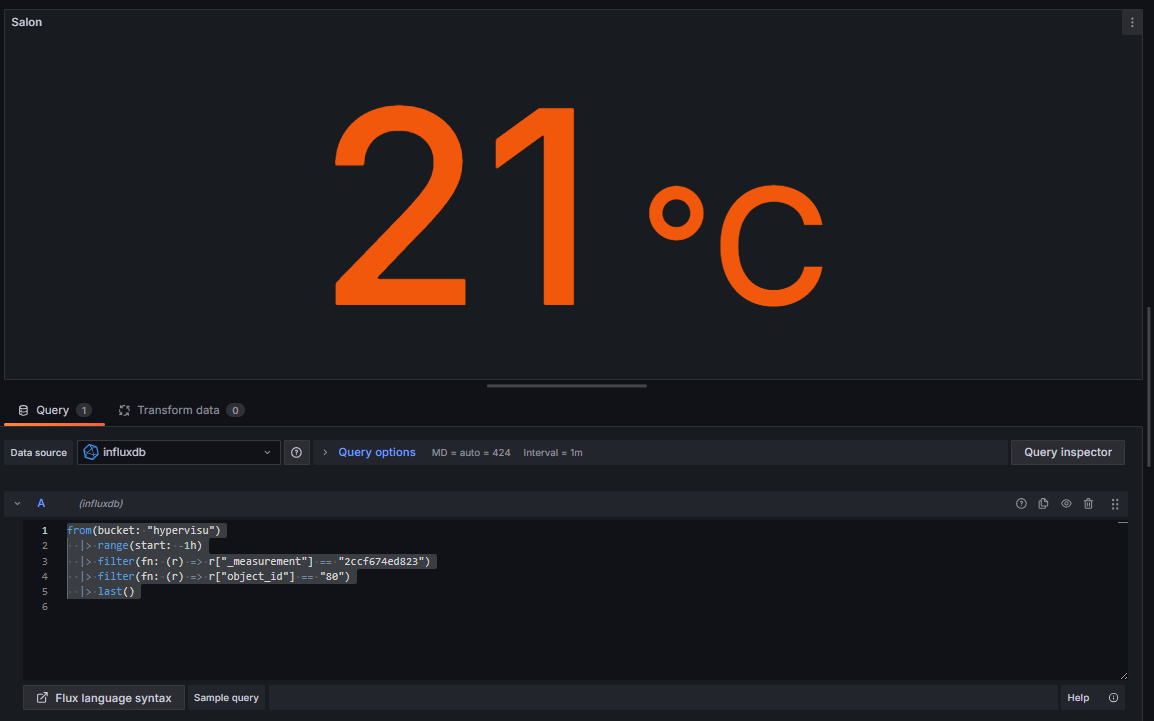
from(bucket: "hypervisu")

 | > range(start: v.timeRangeStart, stop: v.timeRangeStop)
 | > filter(fn: (r) => r["_measurement"] == "2ccf674etf456")  // Replace with your server SN
 | > filter(fn: (r) => r["_field"] == "value_float")
 | > filter(fn: (r) => r["object_id"] == "123")  // Replace with actual object ID
 | > aggregateWindow(every: v.windowPeriod, fn: mean, createEmpty: false)
 | > yield(name: "mean")
To create a complete power consumption panel:
- Create a time series panel
- Paste one of the example queries above, adjusting it for your specific server and widgets IDs
- Set appropriate time ranges (last 24 hours, last week, etc.)
- Add unit formatting (kW, A, kWh) to make the values more readable
- Customize colors to indicate different power levels (e.g., orange for consumption)
Displaying Dashboards in HyperVisu
Once you've created your Grafana dashboards, you can integrate them directly into the HyperVisu mobile application for easy access.
Sharing Dashboard URLs
To find the correct URL for your dashboard:
- Open your dashboard in Grafana
- Click the Share button in the top navigation bar
- Select the Link tab
- Copy the provided URL
Creating WebView Widgets
To display Grafana dashboards in the HyperVisu application:
- In ElauPro, go to the Visualization section
- Click on Add Widget
- Select WebView as the widget type
- Configure the widget:
- Give it a descriptive name (e.g., "Energy Dashboard")
- Assign it to an appropriate category (e.g., "Energy")
- Select the room where you want it to appear
- In the URL field, enter the full URL to your Grafana dashboard
- Format: http://
/ /grafana/d/ / ?orgId=1
- Format: http://
Viewing Dashboards in the Mobile Application
Once configured, you can access your Grafana dashboards directly from the HyperVisu mobile application:
- Open the HyperVisu mobile app
- Navigate to the room or category where your WebView widget is located
- Tap on the WebView widget to open the Grafana dashboard
- The dashboard will load directly within the application, showing real-time and historical data
Optimizing Dashboards for Mobile Viewing
For the best experience on mobile devices:
- Use larger fonts and visualization elements
- Limit the number of panels per dashboard for mobile viewing
- Create separate dashboards optimized for mobile versus desktop viewing
- Consider the portrait orientation of mobile devices when designing layouts
- Test your dashboards on both tablet and phone-sized screens
Note: Changes made to Grafana dashboards are immediately reflected in the HyperVisu application. There's no need to reconfigure the WebView widget after updating a dashboard's content or layout.
On this page
Need additional help?
Our support team is available to answer your technical questions.
Contact support