HyperVisu includes a powerful integration with Grafana, an open-source analytics and visualization platform. With Grafana, you can create sophisticated energy monitoring dashboards, visualize historical data, and gain insights into your smart home’s performance. This section explains how to access Grafana, create dashboards using HyperVisu data, and display these dashboards in the HyperVisu mobile application.
Grafana is directly integrated with the InfluxDB database that stores all your historical data points.
To access the Grafana interface from your HyperVisu server:
Grafana allows you to create customized dashboards that present your data in meaningful ways. These dashboards can include various types of visualizations like graphs, gauges, and statistics panels.
To create a new dashboard:
HyperVisu automatically configures Grafana with the following data sources:
Daily Energy Consumption
Copier
from(bucket: “hypervisu”)
|> range(start: -24h)
|> filter(fn: (r) => r[“_measurement”] == “2ccf674etf456”) // Replace with your server SN
|> filter(fn: (r) => r[“_field”] == “value_float”)
|> filter(fn: (r) => r[“category_name”] == “Energie”)
|> filter(fn: (r) => r[“widget_name”] == “Consommation”)
|> difference()
|> sum()
Maximum Temperature Over the Past Week
Copier
from(bucket: “hypervisu”)
|> range(start: -7d)
|> filter(fn: (r) => r[“_measurement”] == “2ccf674etf456”) // Replace with your server SN
|> filter(fn: (r) => r[“_field”] == “value_float”)
|> filter(fn: (r) => r[“category_name”] == “Climate”)
|> filter(fn: (r) => r[“widget_name”] == “Température”)
|> max()
Average Hourly Power Usage (for Pattern Analysis)
Copier
from(bucket: “hypervisu”)
|> range(start: -7d)
|> filter(fn: (r) => r[“_measurement”] == “2ccf674etf456”) // Replace with your server SN
|> filter(fn: (r) => r[“_field”] == “value_float”)
|> filter(fn: (r) => r[“category_name”] == “Energie”)
|> filter(fn: (r) => r[“widget_name”] == “Puissance Active”)
|> aggregateWindow(every: 1h, fn: mean, createEmpty: false)
|> duplicate(column: “_stop”, as: “hour”)
|> timeShift(duration: -1h, columns: [“hour”])
|> hourSelection(start: 0, stop: 23)
|> group(columns: [“hour”])
|> mean()
Energy monitoring is one of the most powerful applications of Grafana within HyperVisu. Here’s how to create energy visualization panels:
When creating panels, you’ll need to write Flux queries to retrieve data from the HyperVisu InfluxDB database. Here are some examples:
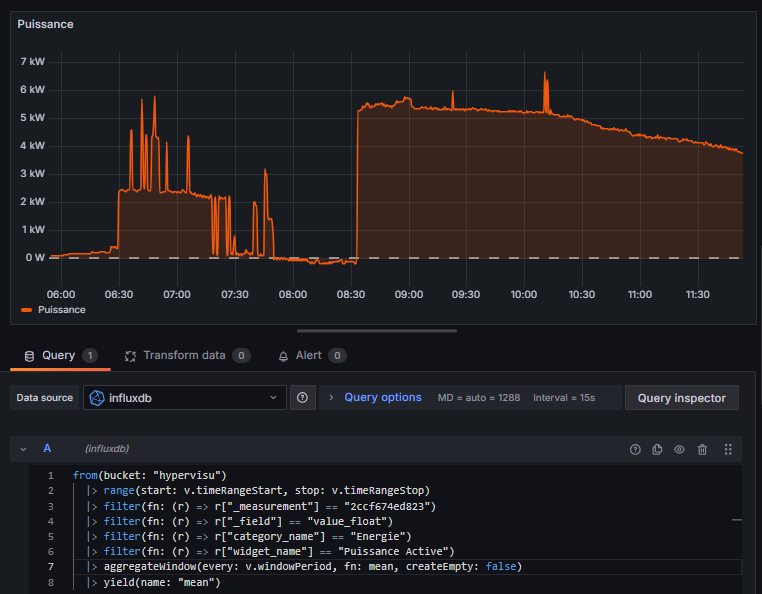
Power Consumption Over Time (Time Series Graph)

Copier
from(bucket: “hypervisu”)
|> range(start: v.timeRangeStart, stop: v.timeRangeStop)
|> filter(fn: (r) => r[“_measurement”] == “2ccf674etf456”) // Replace with your server SN
|> filter(fn: (r) => r[“_field”] == “value_float”)
|> filter(fn: (r) => r[“category_name”] == “Energie”)
|> filter(fn: (r) => r[“widget_name”] == “Puissance Active”)
|> aggregateWindow(every: v.windowPeriod, fn: mean, createEmpty: false)
|> yield(name: “mean”)
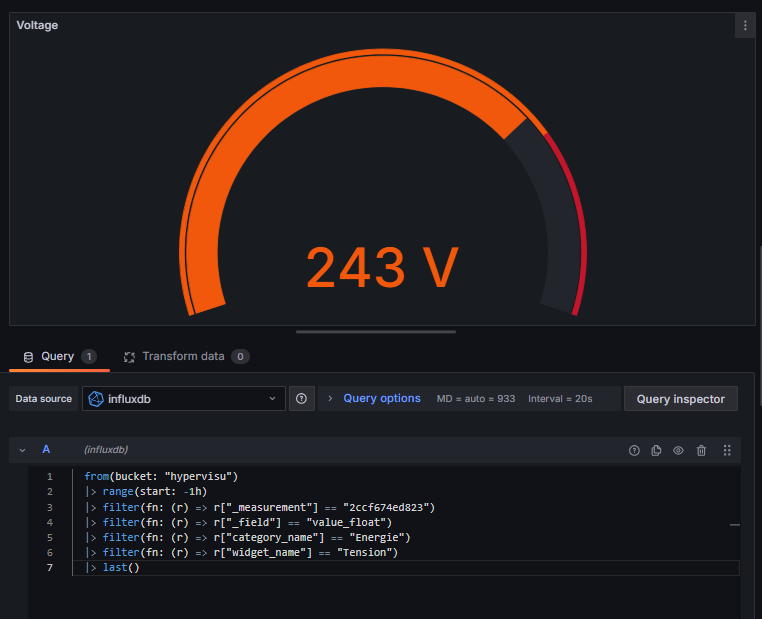
Current Voltage Reading (Gauge or Stat)

Copier
from(bucket: “hypervisu”)
|> range(start: -1h)
|> filter(fn: (r) => r[“_measurement”] == “2ccf674etf456″”) // Replace with your server SN
|> filter(fn: (r) => r[“_field”] == “value_float”)
|> filter(fn: (r) => r[“category_name”] == “Energie”)
|> filter(fn: (r) => r[“widget_name”] == “Tension”)
|> last()
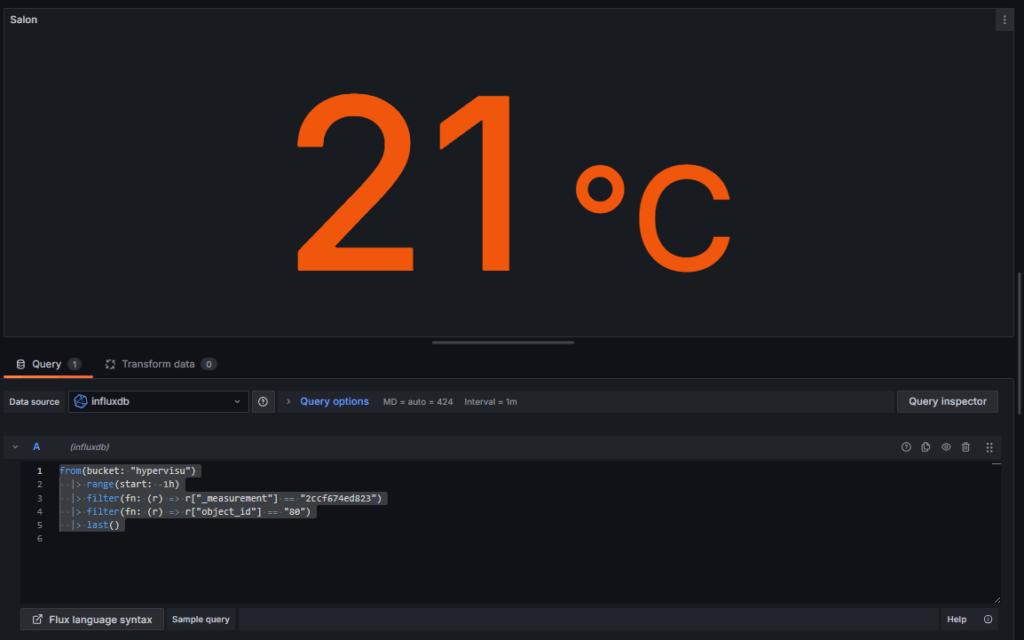
Querying by Object ID
If you know the specific object ID of the widget (found in the “Import/Export” section of the admin page, in the “communication objects” table):

					from(bucket: "hypervisu")
  |> range(start: v.timeRangeStart, stop: v.timeRangeStop)
  |> filter(fn: (r) => r["_measurement"] == "2ccf674etf456")  // Replace with your server SN
  |> filter(fn: (r) => r["_field"] == "value_float")
  |> filter(fn: (r) => r["object_id"] == "123")  // Replace with actual object ID
  |> aggregateWindow(every: v.windowPeriod, fn: mean, createEmpty: false)
  |> yield(name: "mean")
To create a complete power consumption panel:
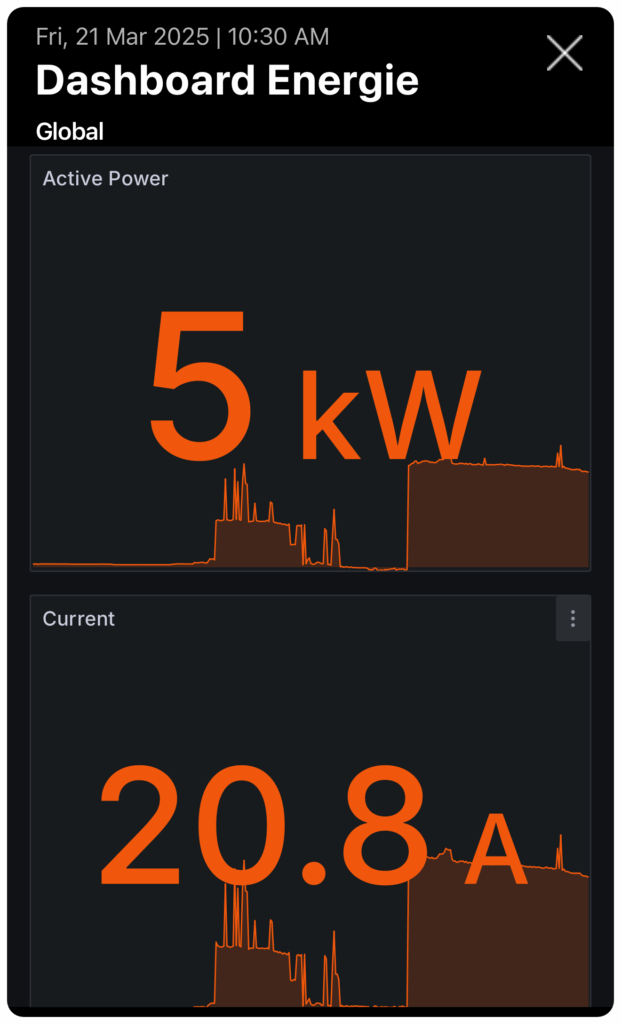
Once you’ve created your Grafana dashboards, you can integrate them directly into the HyperVisu mobile application for easy access.
To find the correct URL for your dashboard:
To display Grafana dashboards in the HyperVisu application:
Once configured, you can access your Grafana dashboards directly from the HyperVisu mobile application:

For the best experience on mobile devices:
Note: Changes made to Grafana dashboards are immediately reflected in the HyperVisu application. There’s no need to reconfigure the WebView widget after updating a dashboard’s content or layout.
© 2024 Elausys. All rights reserved