
This section describes the pieces of a HyperVisu installation and how they talk to each other. Understanding the layout helps when you plan an installation or diagnose a problem.
The HyperVisu server
The HyperVisu server is a compact appliance installed in the building — typically in the electrical cabinet or a technical room, connected to the local network. It runs the HyperVisu software and a set of optional services, stores the whole configuration locally, and is the single point every client connects to. Your data stays on the appliance.
The clients
| Client | Where it runs | What it is for |
|---|---|---|
| HyperVisu app | iOS and Android phones and tablets | Everyday control by residents |
| Web app | Any modern browser | The same app, without installing anything |
| Wall panel mode | 4″ wall-mounted panels | A simplified, paginated presentation for fixed panels (see “Tablet & Wall Panel”) |
| Admin panel | Desktop browser | Configuration and commissioning, administrators only (see Part IV) |
The app adapts its layout to the form factor: phone, tablet (left rail + detail), and wall panel (paginated pads).
Local and cloud access
You can reach the server two ways:
- Local (LAN) — the client connects directly to the server's IP address on your network. Fastest, and works without internet.
- Cloud (the Elausys Cloud Service) — the server keeps an outgoing tunnel open to the Elausys Cloud Service, and clients reach it from anywhere through your server's own cloud address, which is derived from its serial number (see “Accessing the Admin Panel”). No port forwarding, no firewall changes, no fixed public IP needed.
The app accepts either a local IP address or the server serial number, and resolves cloud versus local automatically with fallback (see “Connecting & Signing In”). At home it uses the fast local path; away, it uses the cloud tunnel.
Optional services on the server
The server can run additional services alongside the core software. Enable only what the project uses (see “Services & Protocols”):
- History database (InfluxDB) — stores measurements over time; feeds trend charts, meters, and exports.
- Dashboards (Grafana) — professional charting on top of the history database.
- Node-RED — visual flow programming for custom integrations.
- Camera streaming — restreams camera feeds to the apps.
- Home Assistant — a local Home Assistant instance, useful for Zigbee, Z-Wave and other ecosystems, bridged into HyperVisu.
Supported protocols
| Protocol | Typical devices | Notes |
|---|---|---|
| KNX | The wired building installation | Via a KNX/IP interface (Tunnel UDP) or router (Multicast) |
| Modbus TCP | Inverters, EV chargers, heat pumps, PLCs | Polled registers, multiple servers (see “Modbus TCP Integration”) |
| Home Assistant | Zigbee, Z-Wave, Wi-Fi ecosystems | Local instance or an external one (see “Home Assistant Integration”) |
| HTTP | Devices and services with a web API | Polling and outgoing requests (see “HTTP Integration”) |
| MQTT | Zigbee2MQTT, Tasmota, Shelly, ESPHome and other devices behind an MQTT broker | Subscribe to state topics, publish commands; several brokers (see “MQTT Integration”) |
| BACnet/IP | HVAC controllers, air handling units, VAVs, chillers, meters | Change-of-value subscriptions and polling; network discovery; one connection per device (see “BACnet/IP Integration”) |
| TCP/UDP | AV devices (AUDAC XMP44), PJLink projectors, serial-over-IP bridges, custom boards | Raw command frames and match patterns over TCP or UDP (see “TCP/UDP Integration”) |
| Sonos | Sonos speakers, stereo pairs and home-theatre sets | Native local control — no cloud account and no bridge; one connection per household (see “Sonos Integration”) |
| Virtual | Software-only devices | Groups, Node-RED points, Logic engine outputs (see “Virtual Devices & Node-RED”) |
Data flow in one picture
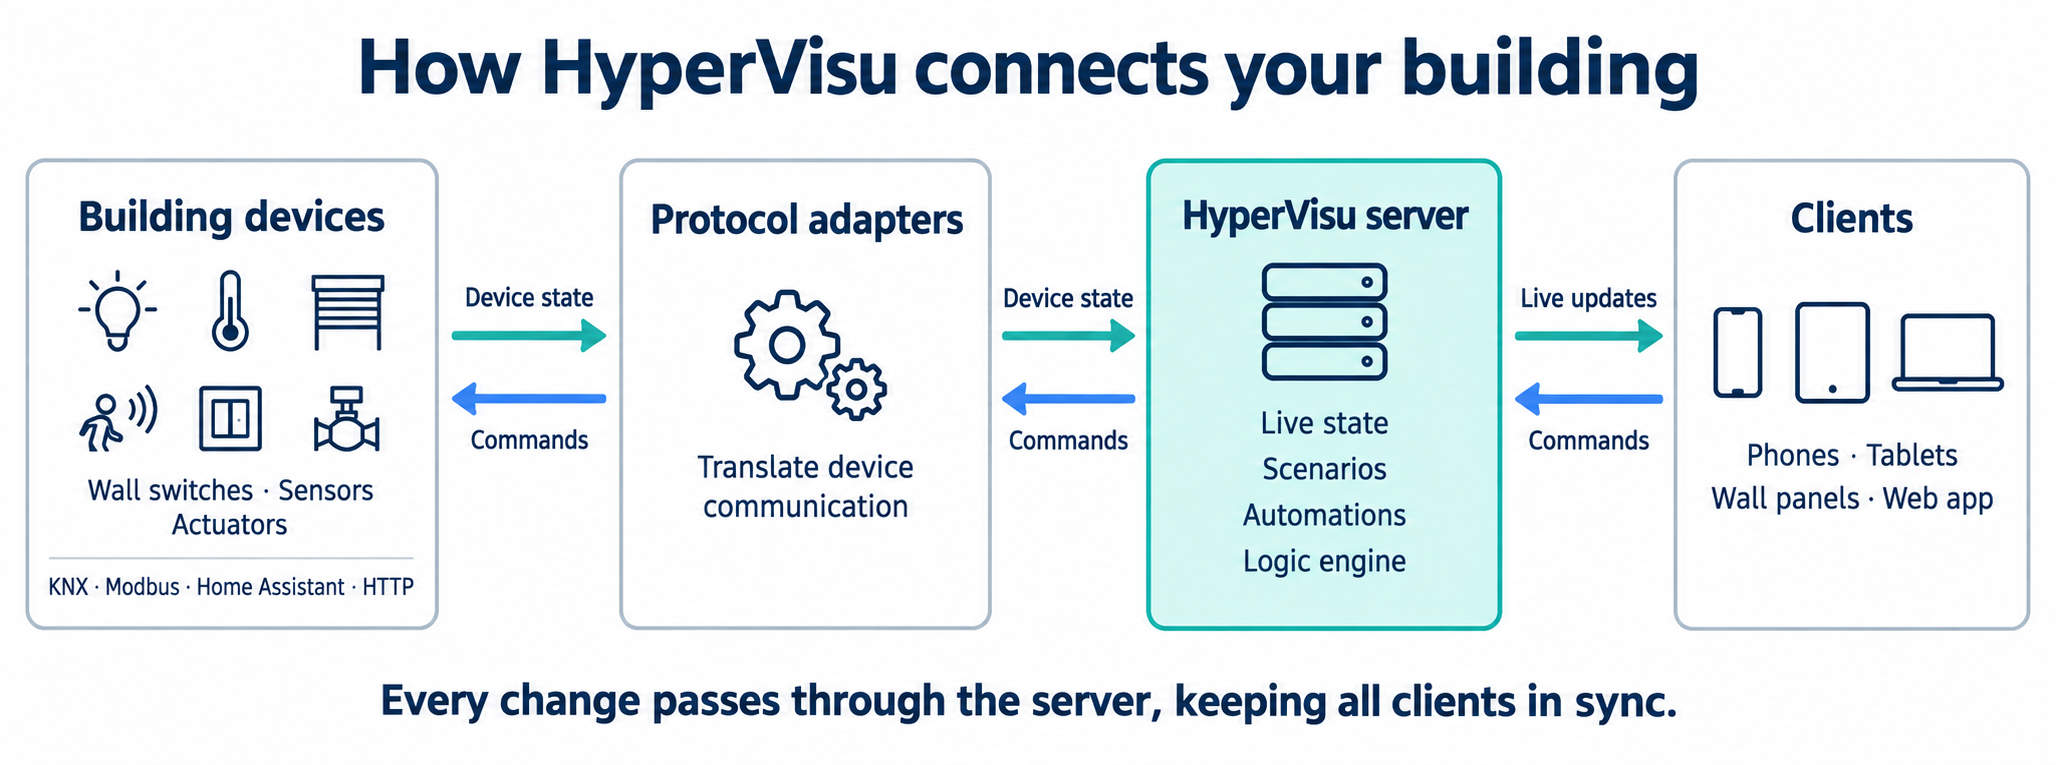
Every value change — from the app, a scenario, an automation, or the physical installation — flows through the server, which keeps all clients in sync.