Measurement & display
Analog input
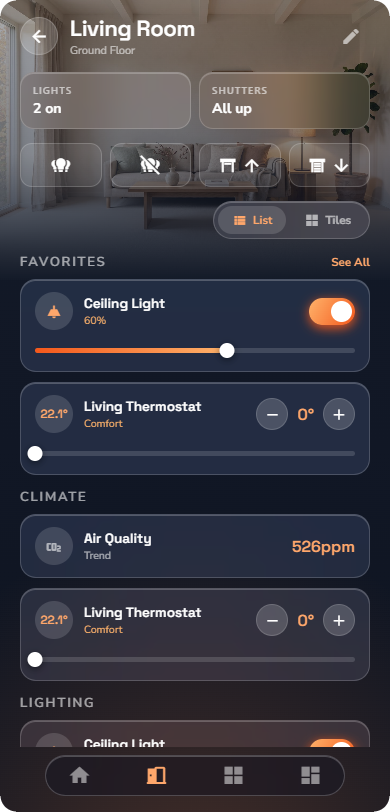
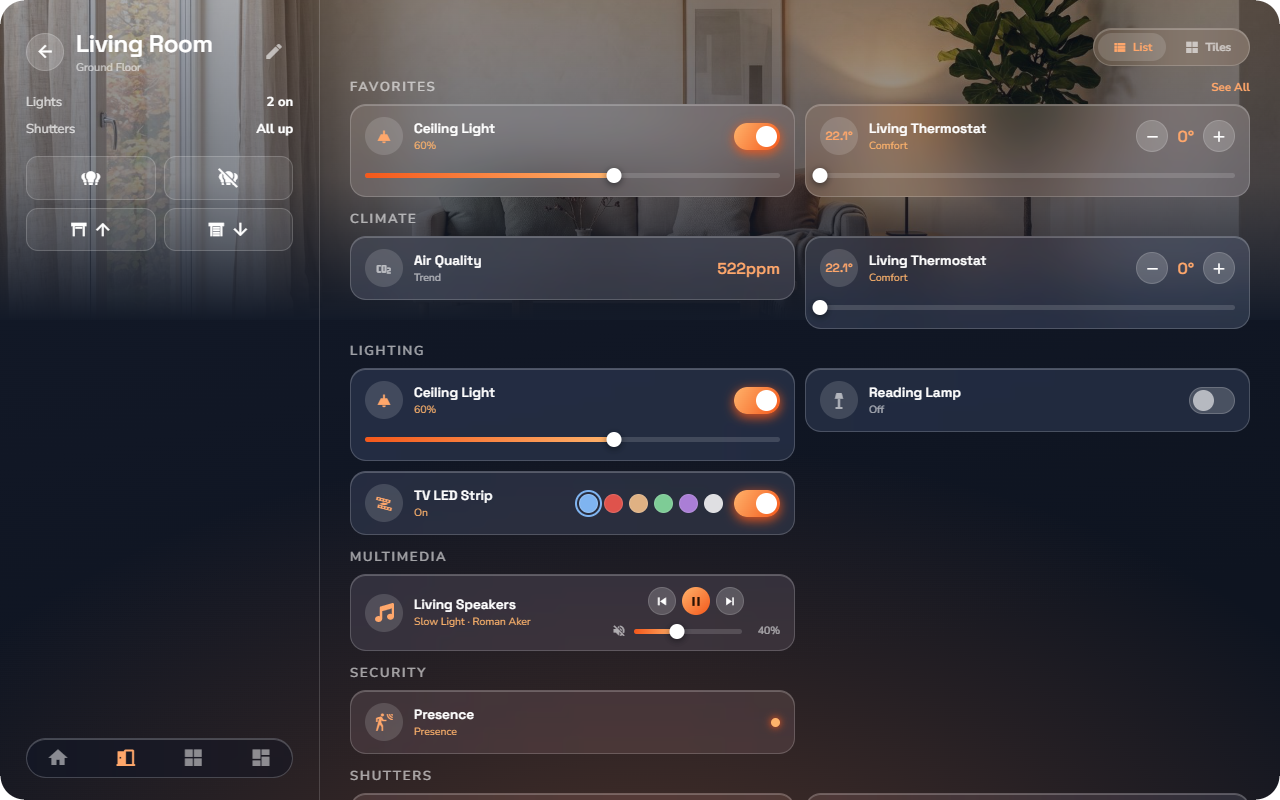
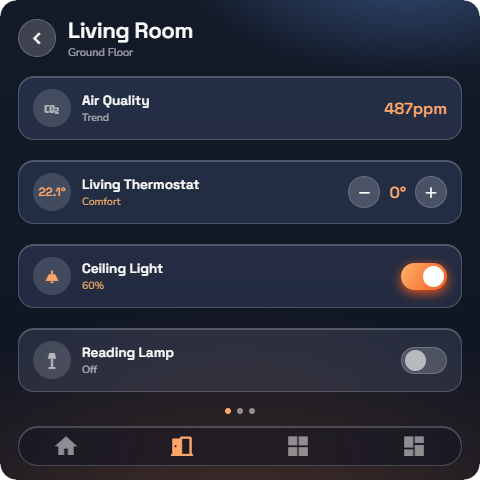
A read-only measured value: a temperature, humidity, CO₂ level, wind speed — anything with a number and a unit.
At a glance: name, the live reading with its unit. There are no controls.
Trending sub-type. If your installer enabled trending on the measurement, tapping it opens a trend page:
- The current reading with its direction (rising or falling).
- The curve over the selected window.
- A period stepper (‹ ›) pages back and forth through past days, weeks, months, or years.
- MIN · AVERAGE · MAX for the window on screen.
- The period picker: Hour / Day / Week / Month / Year.
📘 Note: The trend page needs history logging on that measurement, enabled by your installer. Non-trending inputs simply display their value.
Analog output
A value you set rather than read: a target humidity, a pump speed, a valve position.
At a glance: name, the current value, and a setpoint slider that works directly on the row or tile — drag it and the new value is sent. No detail page.
Text display
A text value written by the system — for example a status message from an integration, an automation or the Logic engine ("All systems OK"). The text is read-only in the app.
At a glance: name and the current text. Tap the field, type the new text, and confirm to send it. No detail page.
Webview
A row that opens one of your home's dashboards — charts and gauges prepared by your installer on the built-in Grafana service or any html webpage.
At a glance: name and icon. Tap the row to open the dashboard full screen; tap back to leave it.