
The activity log answers one question per device: why is it in this state? Every command sent to a device and every state change it reports is recorded with its origin — the resident who tapped it in the app (and which client they used), the scenario, the automation, the Logic function, the weekly schedule, the device group, the KNX bridge, a webhook, or the device itself reporting a change. Use it to find out who switched a light off, whether a scenario really reached all its devices, or whether a command was ever confirmed by the device.
📘 Availability: The activity log is an admin panel feature. It records every device; the apps do not show it.
What you need: the Device Activity Log service enabled (it is on by default — see “Settings and retention” below).
Opening the log
- Open Devices and find the device.
- Click the Activity button (clock icon) in the device row, left of Edit device.
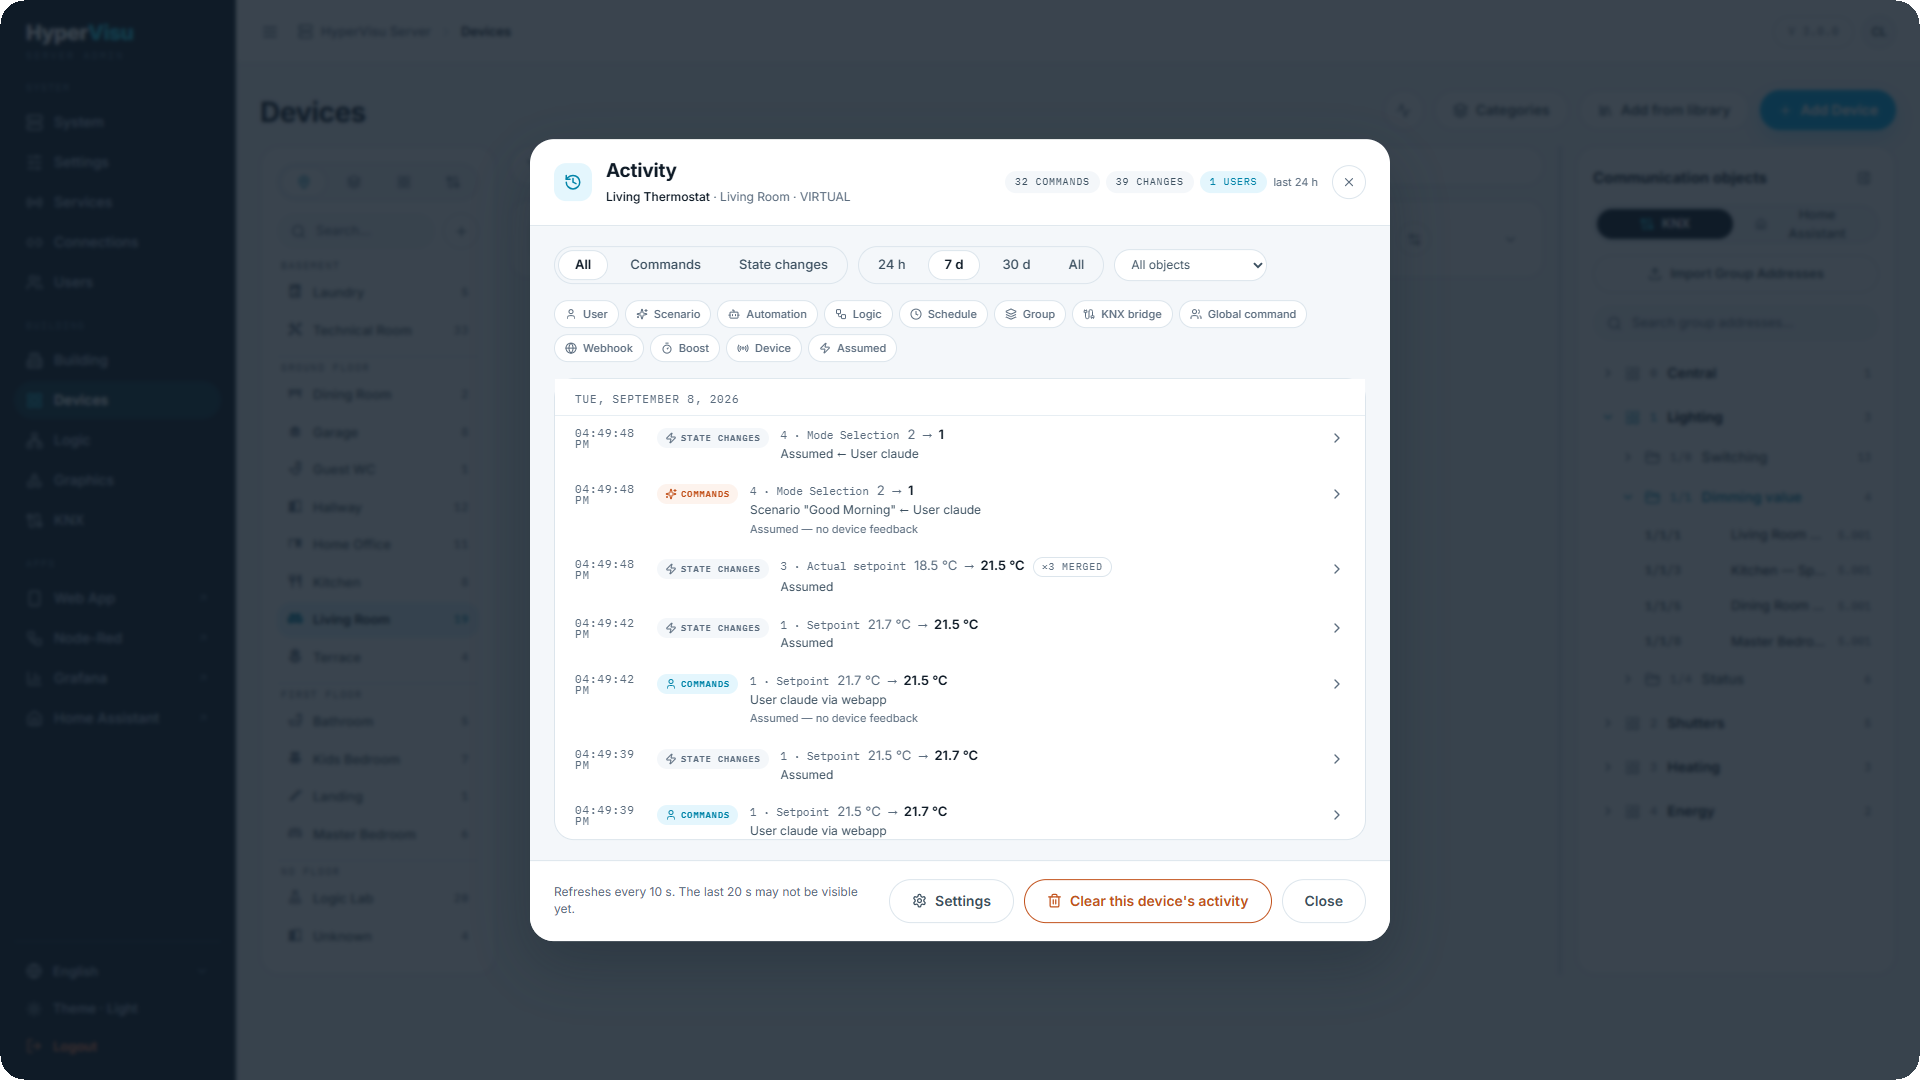
The modal is titled Activity with the device name, its room and its protocol underneath. On the right, three chips give the last 24 hours at a glance: commands, changes and users.
Filters
| Control | What it does |
|---|---|
| All / Commands / State changes | Show everything, only what was sent to the device, or only what the device reported. |
| 24 h / 7 d / 30 d / All | The time range. The default is 7 days. |
| All objects | On a device with several objects (a thermostat has a setpoint, a mode, a temperature…), narrow the list to one object. |
| Origin chips (User, Scenario, Automation, Logic, Schedule, Group, KNX bridge, Global command, Webhook, Boost, Device, Assumed) | Click one or more to keep only those origins. Click again to release. |
Reading a row
Each row shows the time, a COMMANDS or STATE CHANGES tag, the object (when the device has several), the value change as old → new in the device's own units and labels, and one line saying where it came from:
| Origin line | Meaning |
|---|---|
| User name via app / via webapp / via admin | A person sent it, from that client. A name without a client is an older app build that identified itself by name only. |
| Scenario "Evening" ← User name via app | The scenario wrote it, and the arrow says what started the scenario. The chain can be longer: a group commanded by an automation started by a KNX telegram. |
| Automation "…", Logic "…", Schedule "…", Group "…" | The automation, Logic function, weekly program or device group that wrote it. The name is the one it had at the time. |
| KNX bridge group address (sender) | A KNX telegram reached this non-KNX device through the KNX bridge (see “KNX Bridge & Triggers”); the sender is the physical address on the bus. |
| Global command | A room, category or building "all on / all off" command. |
| Device · protocol source | The device reported the change itself — a KNX telegram with the sender's address, a Home Assistant entity, a polled register. |
| Assumed | HyperVisu assumed this state after a command because nothing reports it (a virtual device, a write-only register). |
A command only gets a second line when something is off — a normal, confirmed command says nothing more:
- No confirmation within 5 s — the device never reported the value back; check the binding or the device.
- Failed with the error text — the command could not be sent (for example, the KNX interface was not connected).
Whether a value was measured or assumed shows on the state rows themselves: an Assumed row is HyperVisu's own guess after a command, a Device row is what the device reported.
A ×n merged badge on a state row means n readings of a number (a temperature, a power) inside the merge window became one row; the row shows the latest value and the time of the latest reading (see “Settings and retention” below for the window).
What happened
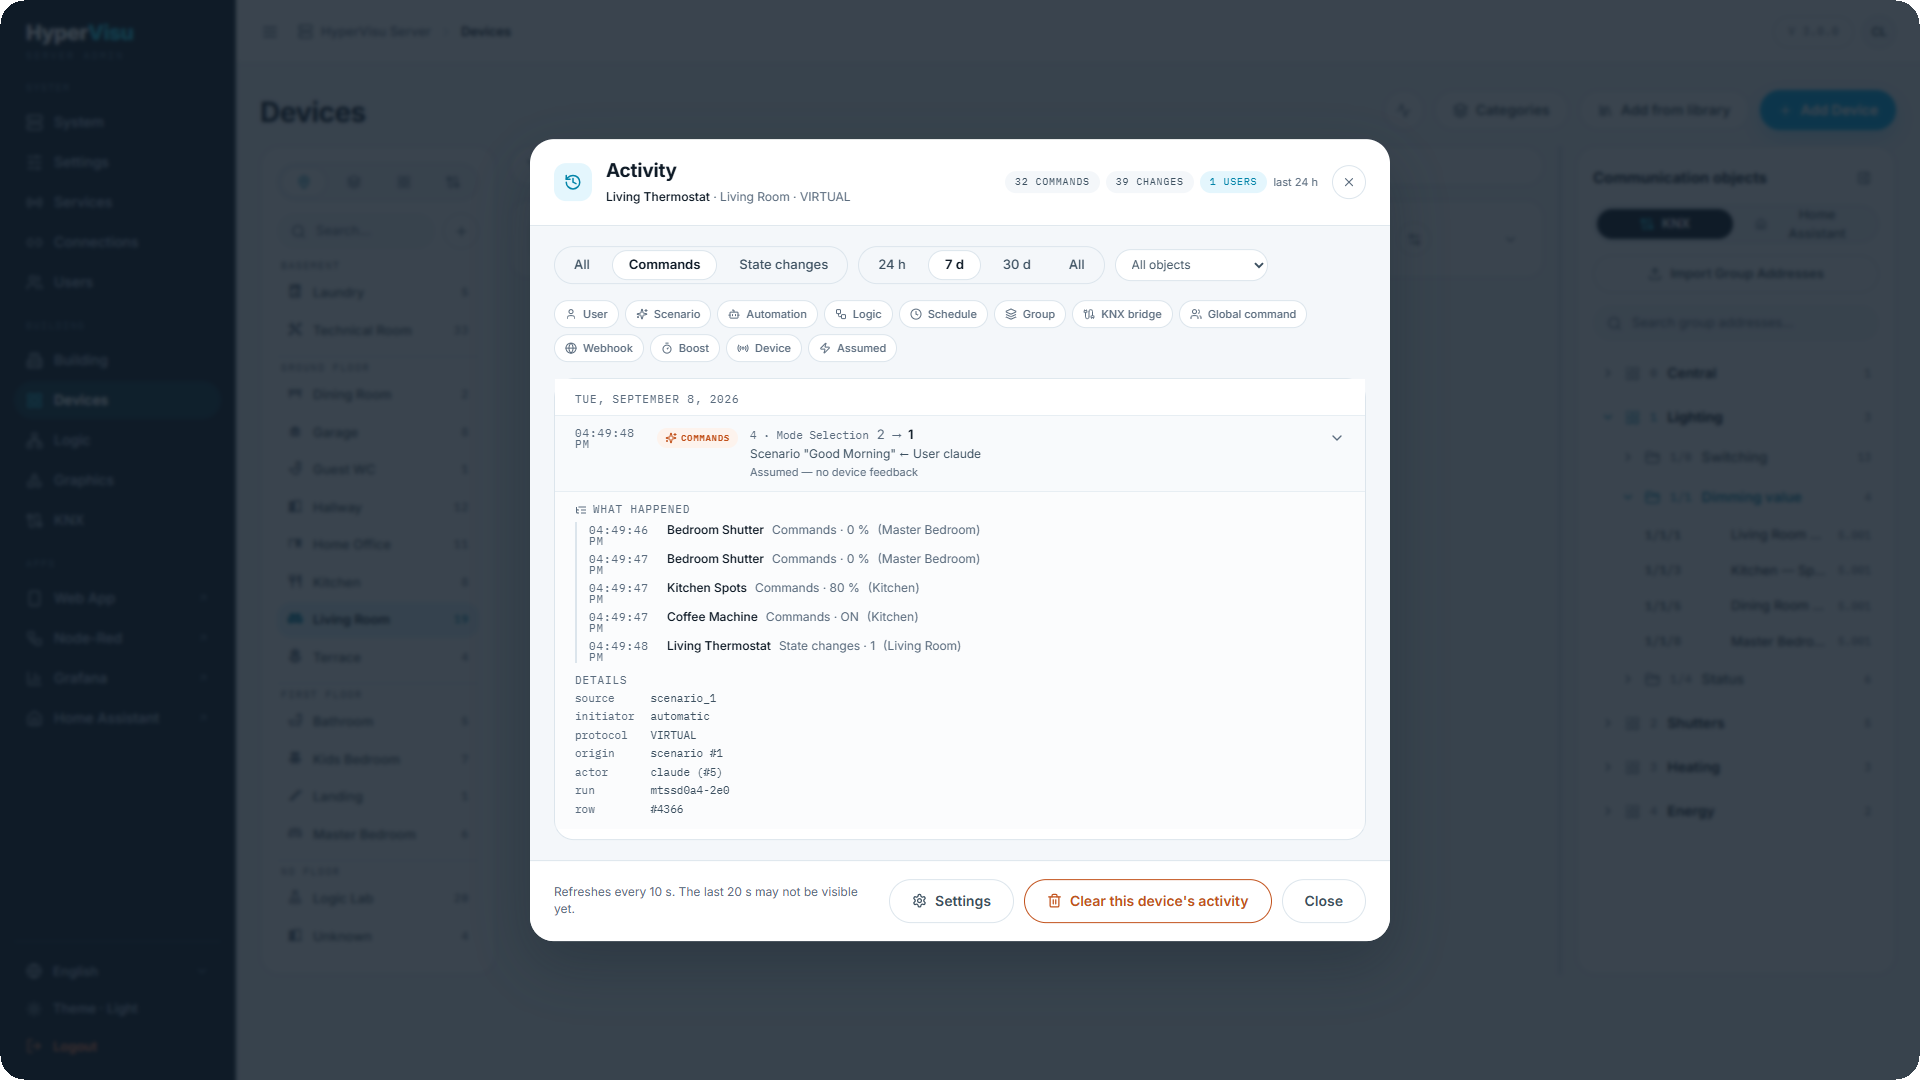
Click a row to expand it. What happened lists every other change in the same run — the other devices a scenario or automation touched, the assumed state that followed a command — each with its time, device and value. Details shows the raw facts behind the row: the source and initiator tags, the protocol, and the KNX sender or Home Assistant entity — and a note when the scenario or automation that wrote it has since been deleted.
Keeping it tidy
- The footer says how fresh the view is: rows reach the log a few seconds after they happen (the server writes them in batches, about every 20 seconds by default), and the modal refreshes every 10 seconds while it is open.
- Settings opens the Device Activity Log page (below).
- Clear this device's activity deletes the rows of this device only. The button asks for a second click before it deletes.
📘 Note: Not everything becomes a row. A report that does not change the value is skipped. Objects that already stream their readings to the history database (the logging switch, see “Object Settings, Logging & Notifications”) record only commands, not state changes — the history database already has the readings, and the History tab below charts them. A feedback object that only carries a value to its main object is not listed; the main object's row is the one you see.
💡 Tip: Use the User chip with the 30 d range on the alarm device to see who armed and disarmed it, and when.
The History tab
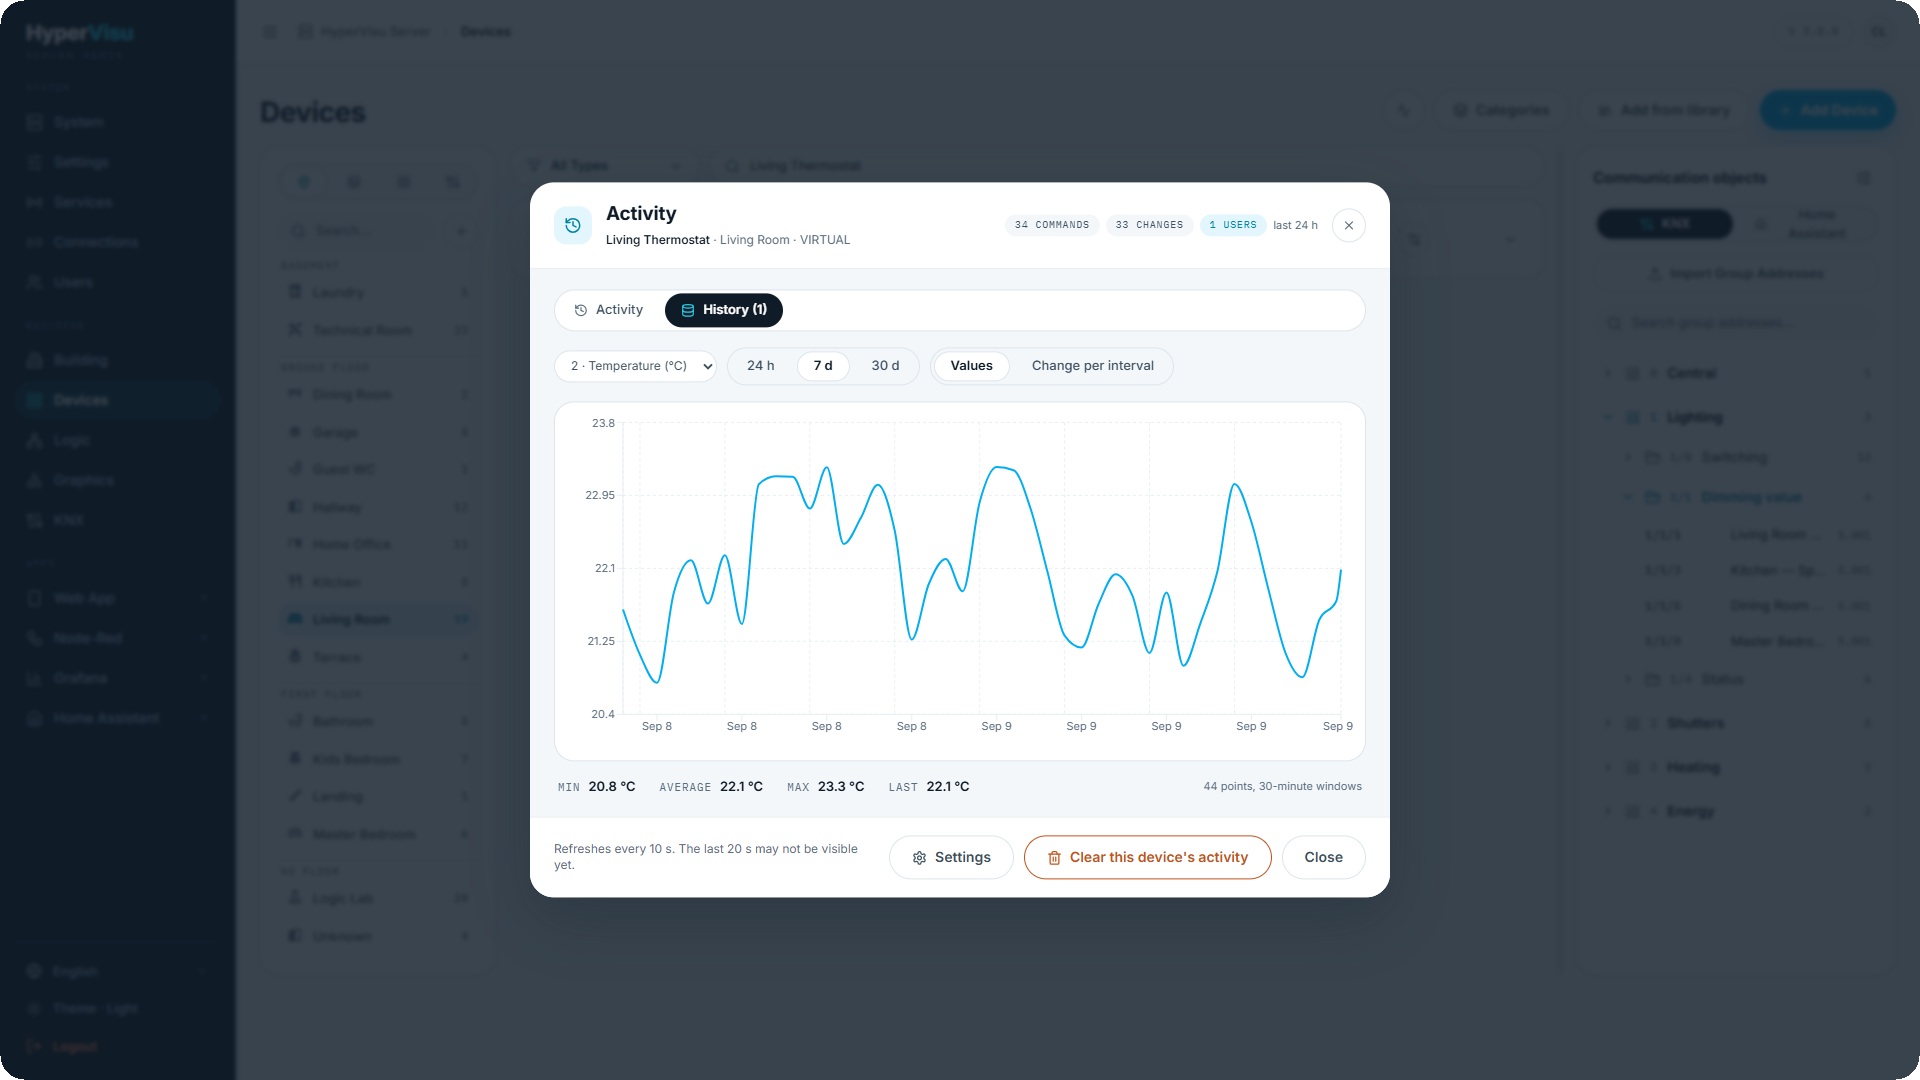
The modal has two tabs. Activity is the timeline above. History charts the logged values of the device's objects from the history database — the counterpart for devices that only report: a meter, a sensor, a temperature probe. The tab shows how many of the device's objects are logged; when none is, it says so and points to the logging switch (see “Object Settings, Logging & Notifications”).
- Pick the object in the dropdown (only logged objects are listed, with their unit).
- Pick the range: 24 h, 7 d or 30 d. Each range has its own averaging window — 5 minutes, 30 minutes and 2 hours — so a 30-day chart stays a few hundred points whatever the logging rate. There is deliberately no "all" range: an unbounded query is what made the app's yearly energy chart time out.
- For a number, choose Values (the average per window — a trend) or Change per interval (the difference between the last reading of consecutive windows — the consumption per window of a meter counter). A boolean object shows ON and OFF as a step line and its percentage of time ON in the figures.
Under the chart, Min, Average, Max and Last are computed over the windows shown, in the object's unit and decimals, with the number of points and the window size on the right. The chart refreshes every minute while the tab is open.
📘 Note: A device whose objects are all logged shows no state changes on the Activity tab. Its empty state says so and offers the History tab directly.
Settings and retention
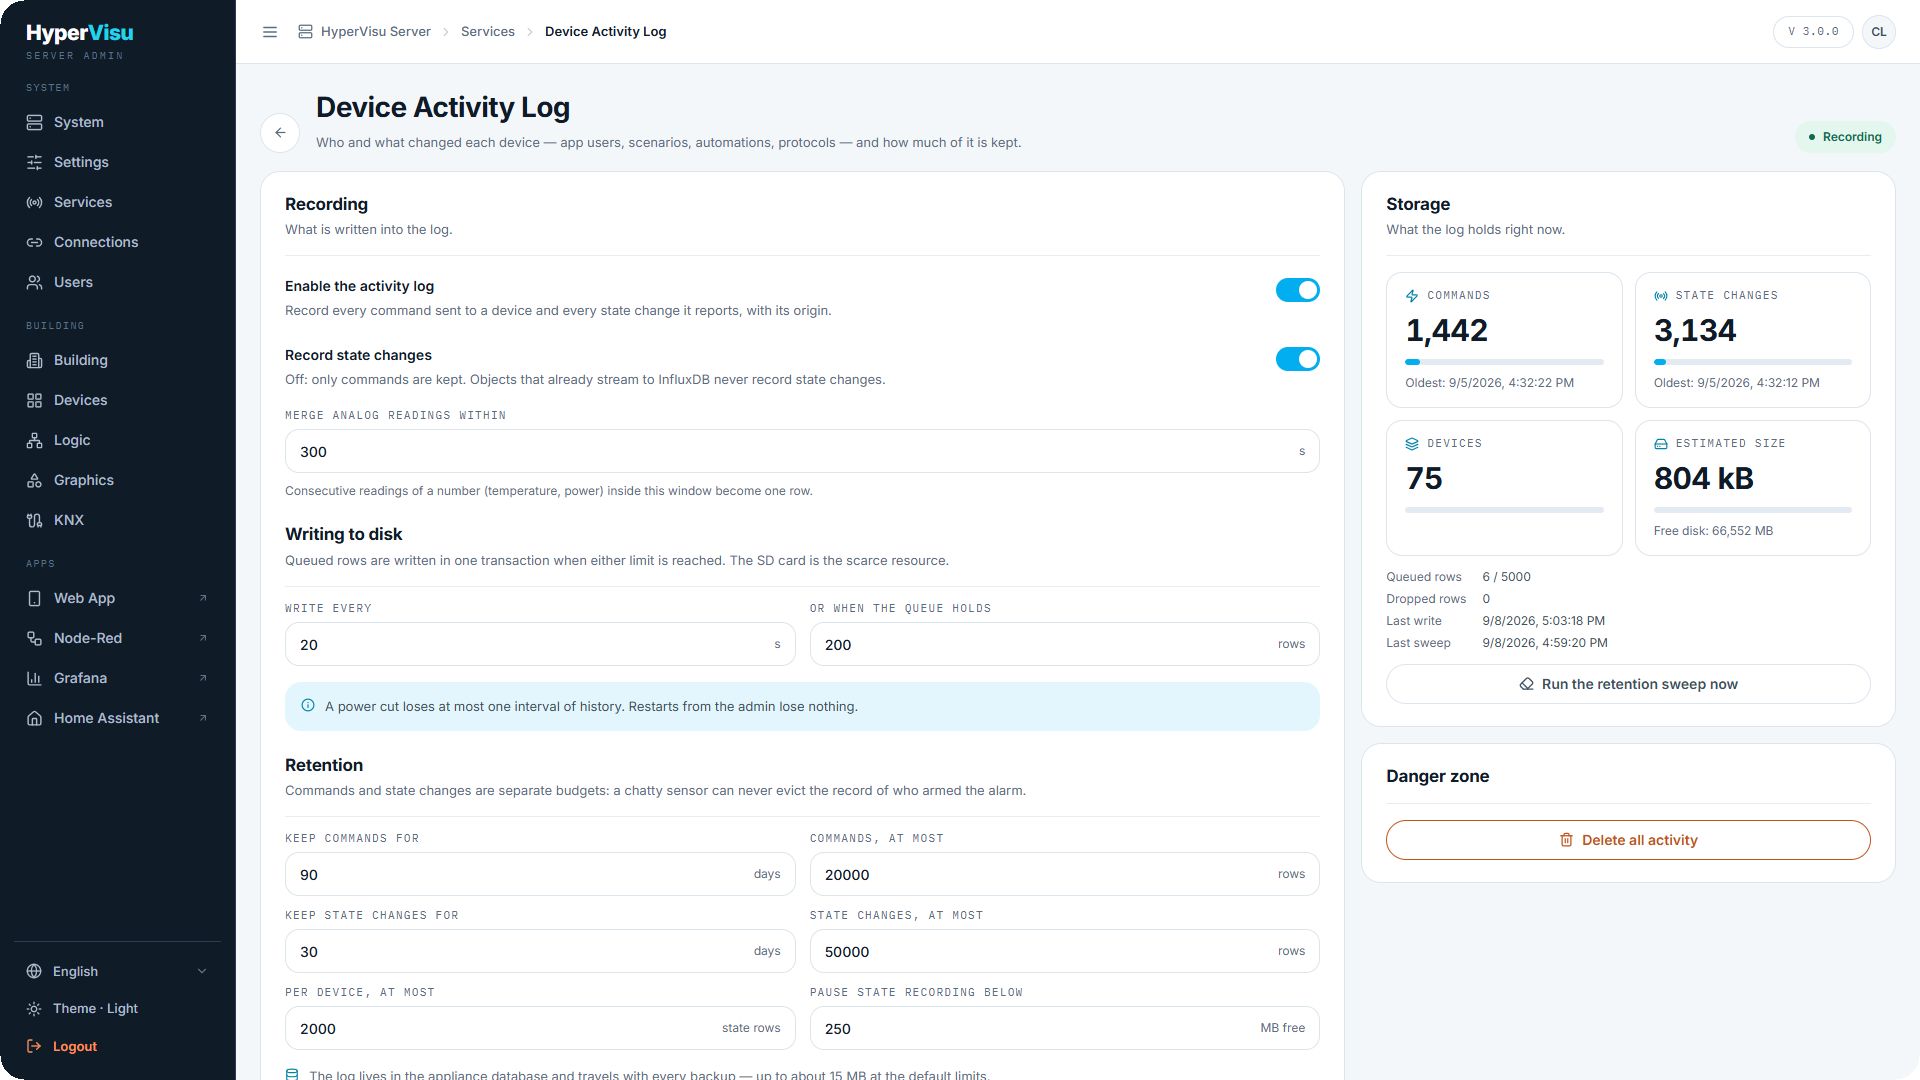
The Device Activity Log page (Services → Device Activity Log → Configure) decides what the activity log records and how much of it the server keeps. The log lives in the server's own database, so its size is bounded on purpose: the settings are budgets, not just preferences.
The status pill in the header reads Recording or Disabled. The Device Activity Log row on the Services page (see “Services & Protocols”) has the same on/off switch.
Recording
| Setting | What it does |
|---|---|
| Enable the activity log | Record every command sent to a device and every state change it reports, with its origin. Off: nothing is recorded (existing rows stay). |
| Record state changes | Off: only commands are kept. Objects whose readings already go to the history database never record state changes, whatever this switch says. |
| Merge analog readings within n s | Consecutive readings of a number (temperature, power) inside this window become one row with a ×n merged badge. 0 keeps every reading as its own row. Default 300. |
Writing to disk
Rows wait in memory and are written in one batch when either limit is reached. The default is every 20 s or 200 rows, whichever comes first.
📘 Note: A power cut loses at most one interval of history. A reboot or restart from the admin panel writes the waiting rows first and loses nothing. Keep the interval at 20 s or more: the server's storage card is the scarce resource, and each batch is one write.
Retention
Commands and state changes have separate budgets, so a chatty sensor can never push out the record of who armed the alarm.
| Setting | Default |
|---|---|
| Keep commands for | 90 days |
| Commands, at most | 20 000 rows |
| Keep state changes for | 30 days |
| State changes, at most | 50 000 rows |
| Per device, at most | 2 000 state rows |
| Pause state recording below | 250 MB free |
The server applies these limits every ten minutes and at boot: rows older than the retention, rows above a cap (oldest first), state rows above the per-device cap, and rows of devices that no longer exist. When free storage drops below the last threshold, state recording pauses (commands are still recorded) and resumes once 100 MB more is free again.
Click Save settings to apply. The server picks the new values up immediately.
Storage
The right-hand card shows what the log holds right now: the number of Commands and State changes with their oldest entry and how full each budget is, the number of Devices with rows, the Estimated size and the free storage, the rows still Queued in memory, rows Dropped (only when the memory queue overflowed), and the time of the Last write and Last sweep. Run the retention sweep now applies the limits without waiting for the next ten-minute pass and reports how many rows it removed.
Deleting the log
Delete all activity in the Danger zone empties the log for every device after a confirmation. To delete one device's rows only, use Clear this device's activity in that device's Activity modal.
📘 Note: The log is part of the server database, so it is included in every backup (see “Backup & Restore”) — up to about 15 MB at the default limits — and erased by a factory reset (see “Factory Reset”).