Object settings
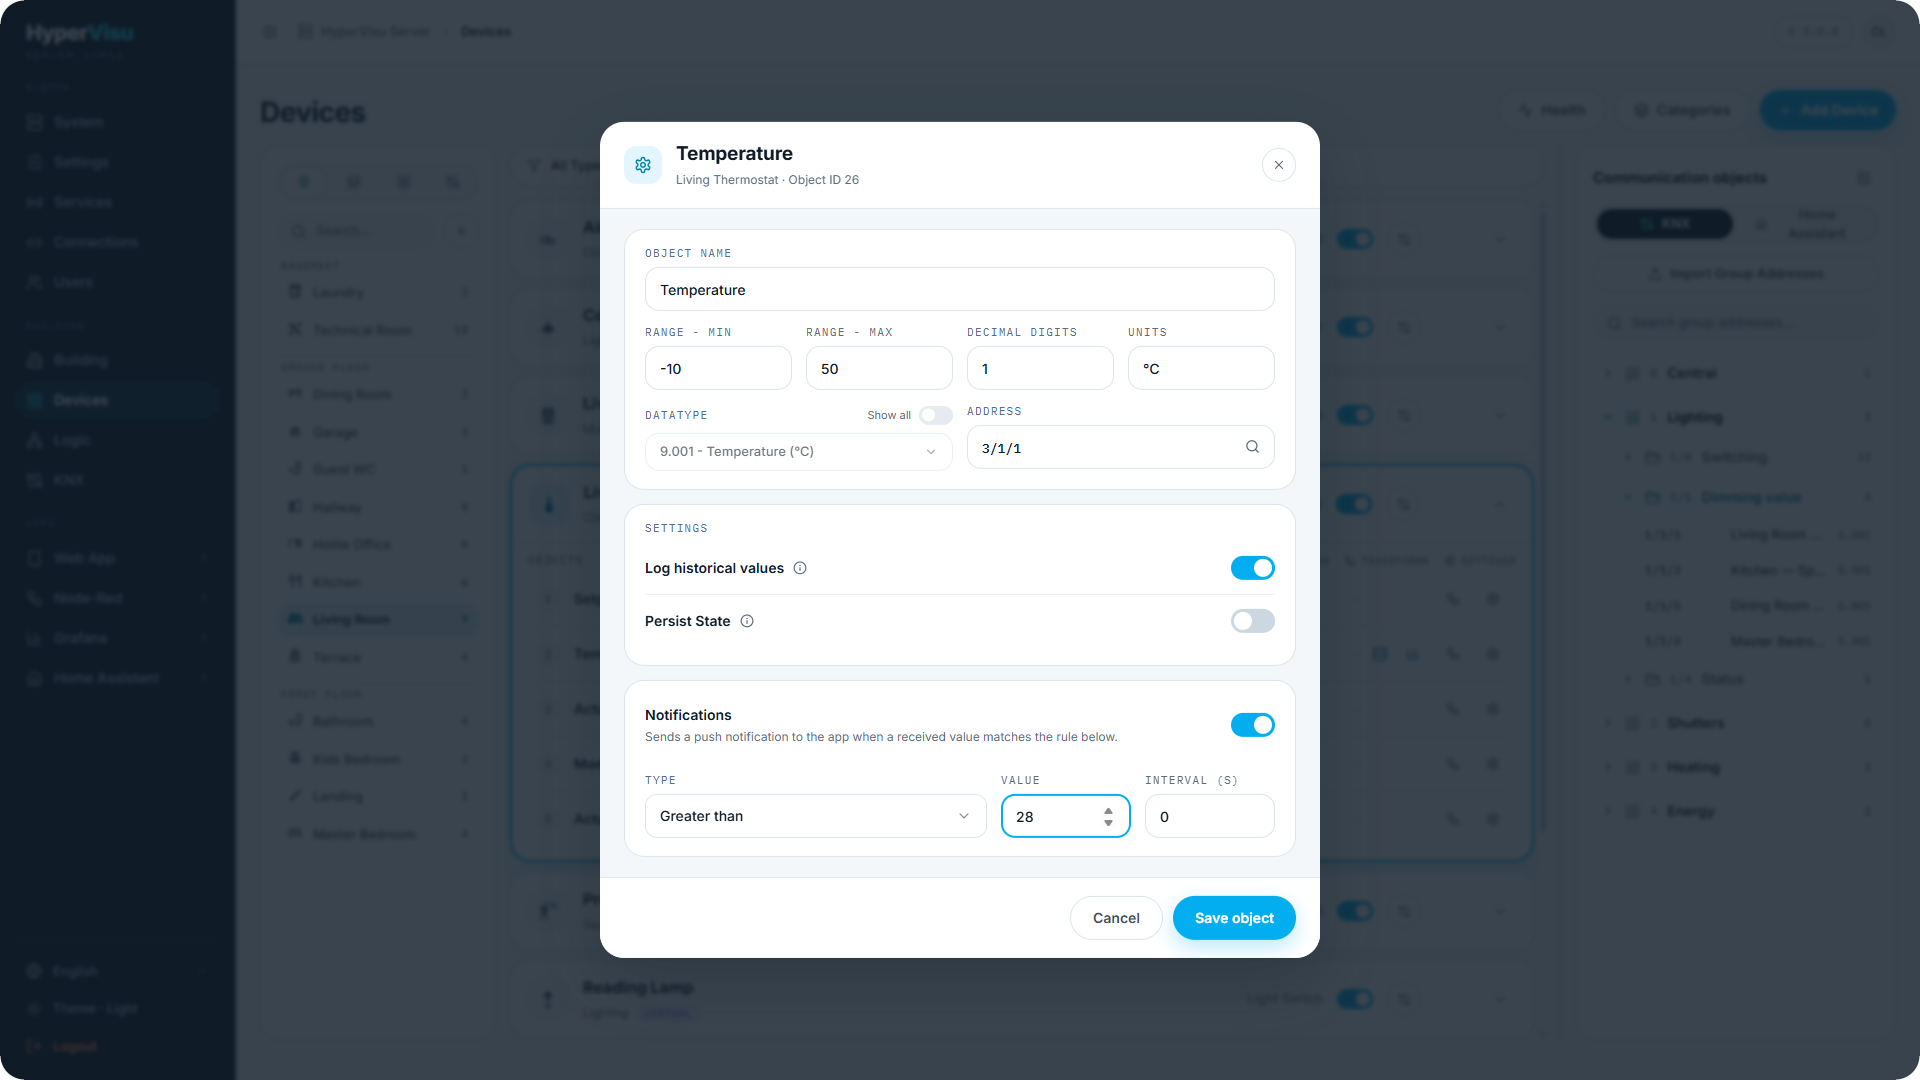
Every communication object has a settings dialog — open the object row and click Edit. What you see depends on the protocol, but the common parts are:
General
| Field | Description |
|---|---|
| Name | The object's name. |
| Datatype | The object's data type. Picking a data type that differs from the object's native type shows a warning: a transformation is required to convert between them (see “Value Transformations & Health”). |
| Direction | In, out, or both. |
Value settings
| Field | Description |
|---|---|
| Range - Min / Max | The value range. |
| Label - Min / Max | Labels for the range ends (e.g. Closed / Open). |
| Decimal digits | Display precision. |
| Units | The displayed unit (e.g. °C, kWh). |
Per-protocol settings
- KNX: Group Address, Data Point Type — the server reads the address at startup so the app shows a value immediately.
- Home Assistant: Entity ID and optionally the Attribute to read.
- Modbus: see “Modbus TCP Integration”.
- HTTP: see “HTTP Integration”.
- MQTT: topic, payload format, publishing and subscribing options — see “MQTT Integration”.
- BACnet/IP: object type and instance, value type, change-of-value subscription and write priority — see “BACnet/IP Integration”.
- TCP/UDP: key, command and query templates, match pattern — see “TCP/UDP Integration”.
- Virtual: Default Value and Persistent (keep the value across restarts) — see “Virtual Devices & Node-RED”.
- Camera: the Camera Stream URL (see “Cameras & Videophone Setup”).
- Videophone: the videophone address and credentials (see “Cameras & Videophone Setup”).
Notifications
An object can raise a push notification when a received value matches a rule:
| Field | Description |
|---|---|
| Type | No (off), Equal, Greater than, Lower than. |
| Value | The threshold or match value. |
| Interval (s) | Minimum time between repeated notifications for the same condition. |
Notifications are delivered to the app as push messages (see “Push Notifications”).
Logging
- Enable logging — writes every value change to the time-series history (InfluxDB). This is what feeds trends in the app, meter charts, Grafana dashboards and CSV export (see “History & Data Logging”). The device row then carries the LOGGED badge.
- Persist State — saves the value on change and restores it after a server restart.
Changes take effect on save; logging starts with the next received value.
The Grafana panel builder
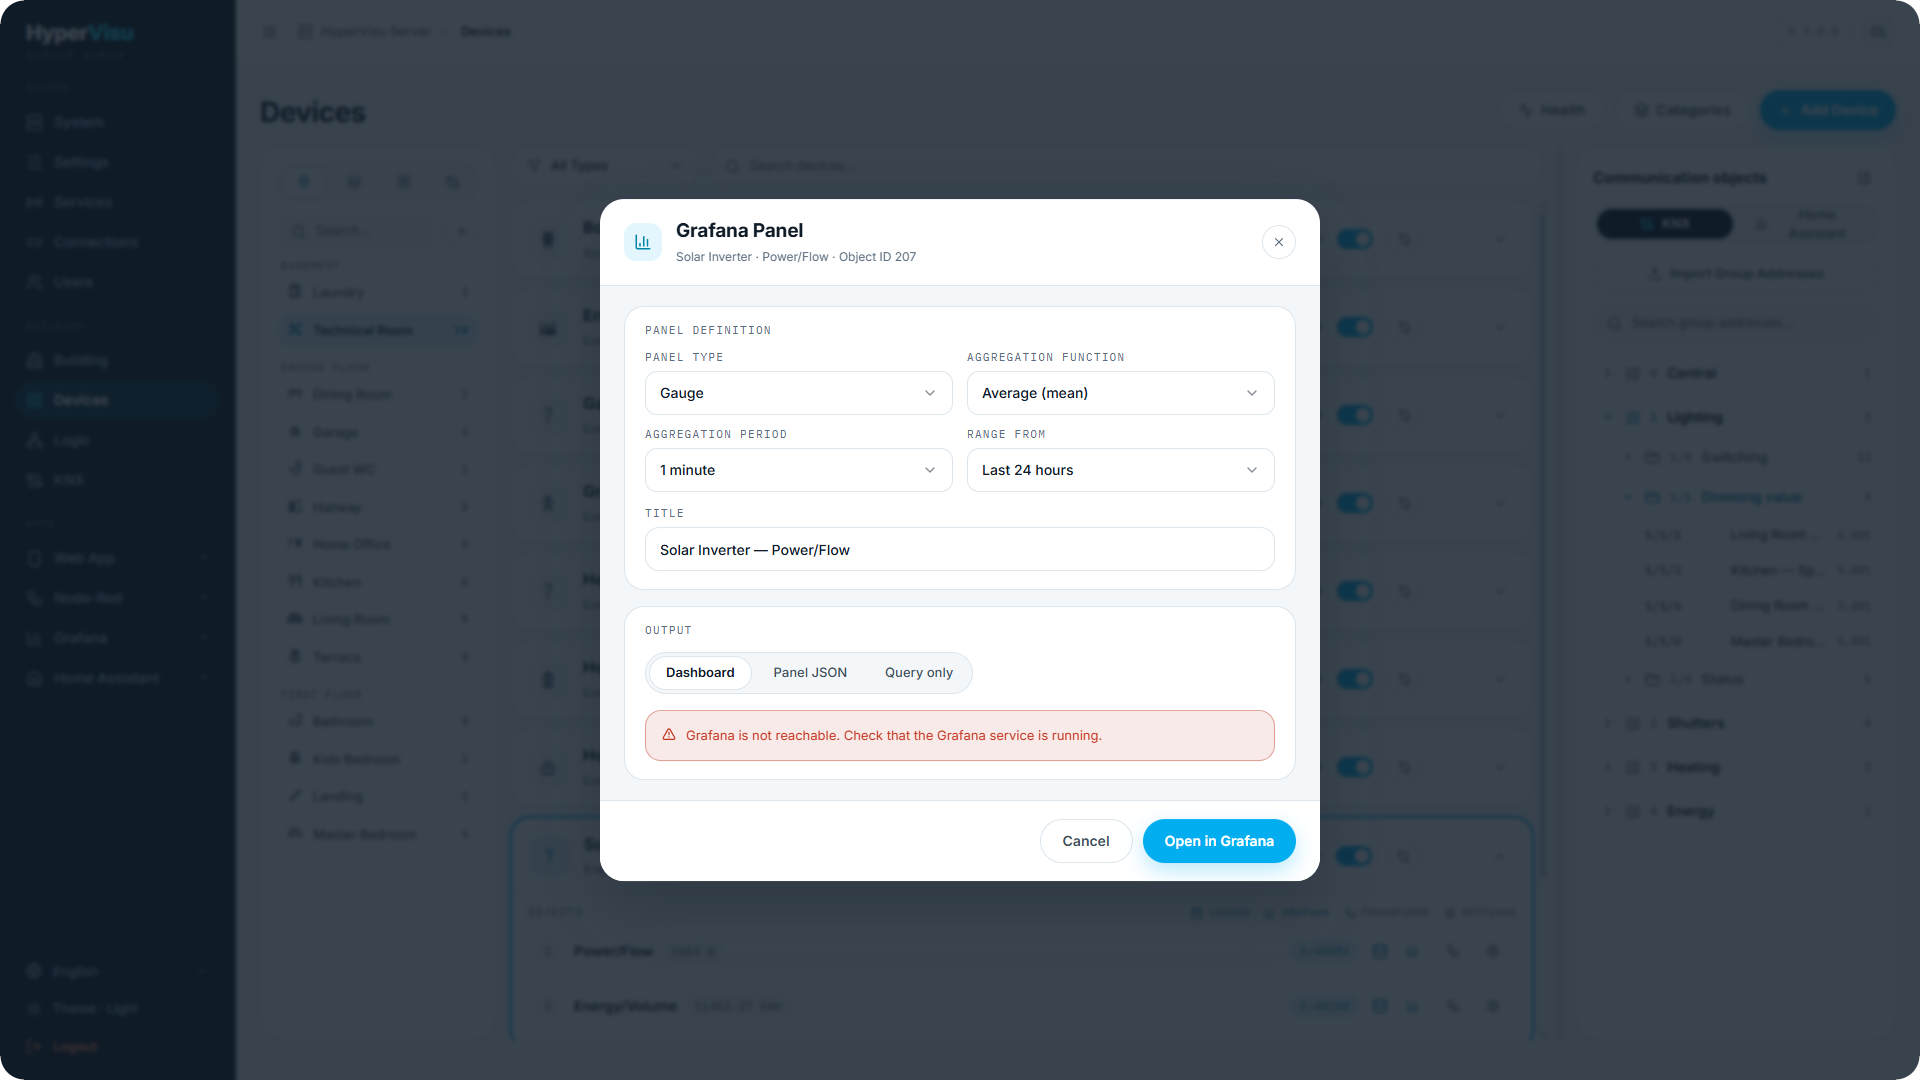
Logged objects offer a Grafana panel action that builds a Grafana panel or Flux query for the object:
- Pick the panel type, the aggregation function and aggregation period, the time range, and a title.
- Then either copy the Panel JSON or the query only (Flux) to paste into Grafana yourself, or pick a target dashboard and click Add panel — the panel is appended to that dashboard. You can also create a new dashboard by name.
If something is missing, the dialog says exactly what: Grafana is disabled (enable it in Services), no API token is set (see “Services & Protocols”), Grafana is unreachable, or the token lacks Editor permission. Details on Grafana and dashboards are in “History & Data Logging”.