
HyperVisu stores time-series history in the on-appliance history database (InfluxDB). This chapter covers connecting it, exporting measurement data as CSV, building Grafana panels, and moving whole configuration tables in and out of the server as CSV files.
InfluxDB connection
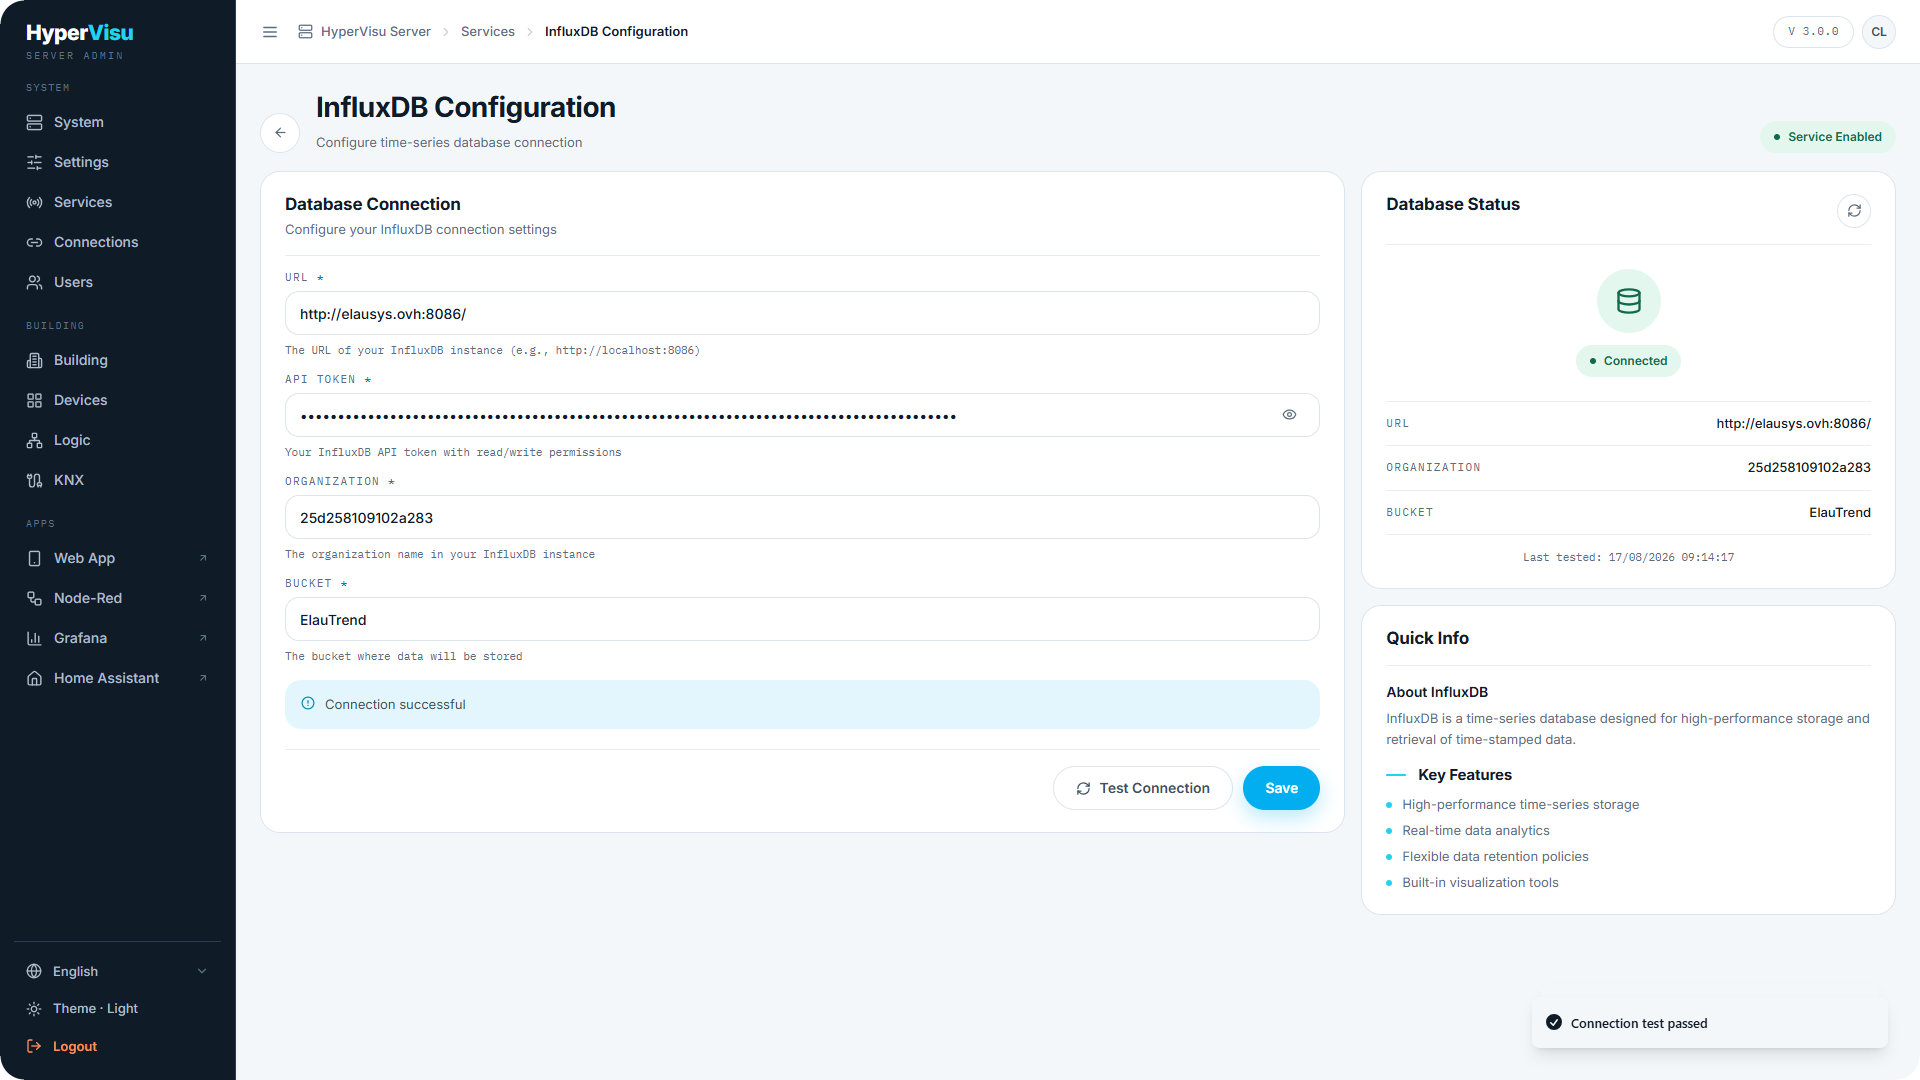
The InfluxDB Configuration page (reachable from Services) holds the connection the server uses to write and read history.
| Field | What to enter |
|---|---|
| URL | The address of the InfluxDB instance (e.g. http://localhost:8086). |
| API Token | A token with read/write permissions. Use the eye button to show or hide it. |
| Organization | The organization name in your InfluxDB instance. |
| Bucket | The bucket where data is stored. |
Click Test Connection to verify. The Database Status card shows Connected or Not Tested plus the Last tested time. If the InfluxDB service itself is disabled, an alert on the page tells you to enable it from the Services page first.
What gets logged. Nothing is logged by default. You opt in per communication object with the logging switch in the object settings (see “Object Settings, Logging & Notifications”). Logged objects feed the trend charts and meter history in the app, Grafana dashboards, the KNX bus-monitor charts, and the CSV export below.
CSV data export
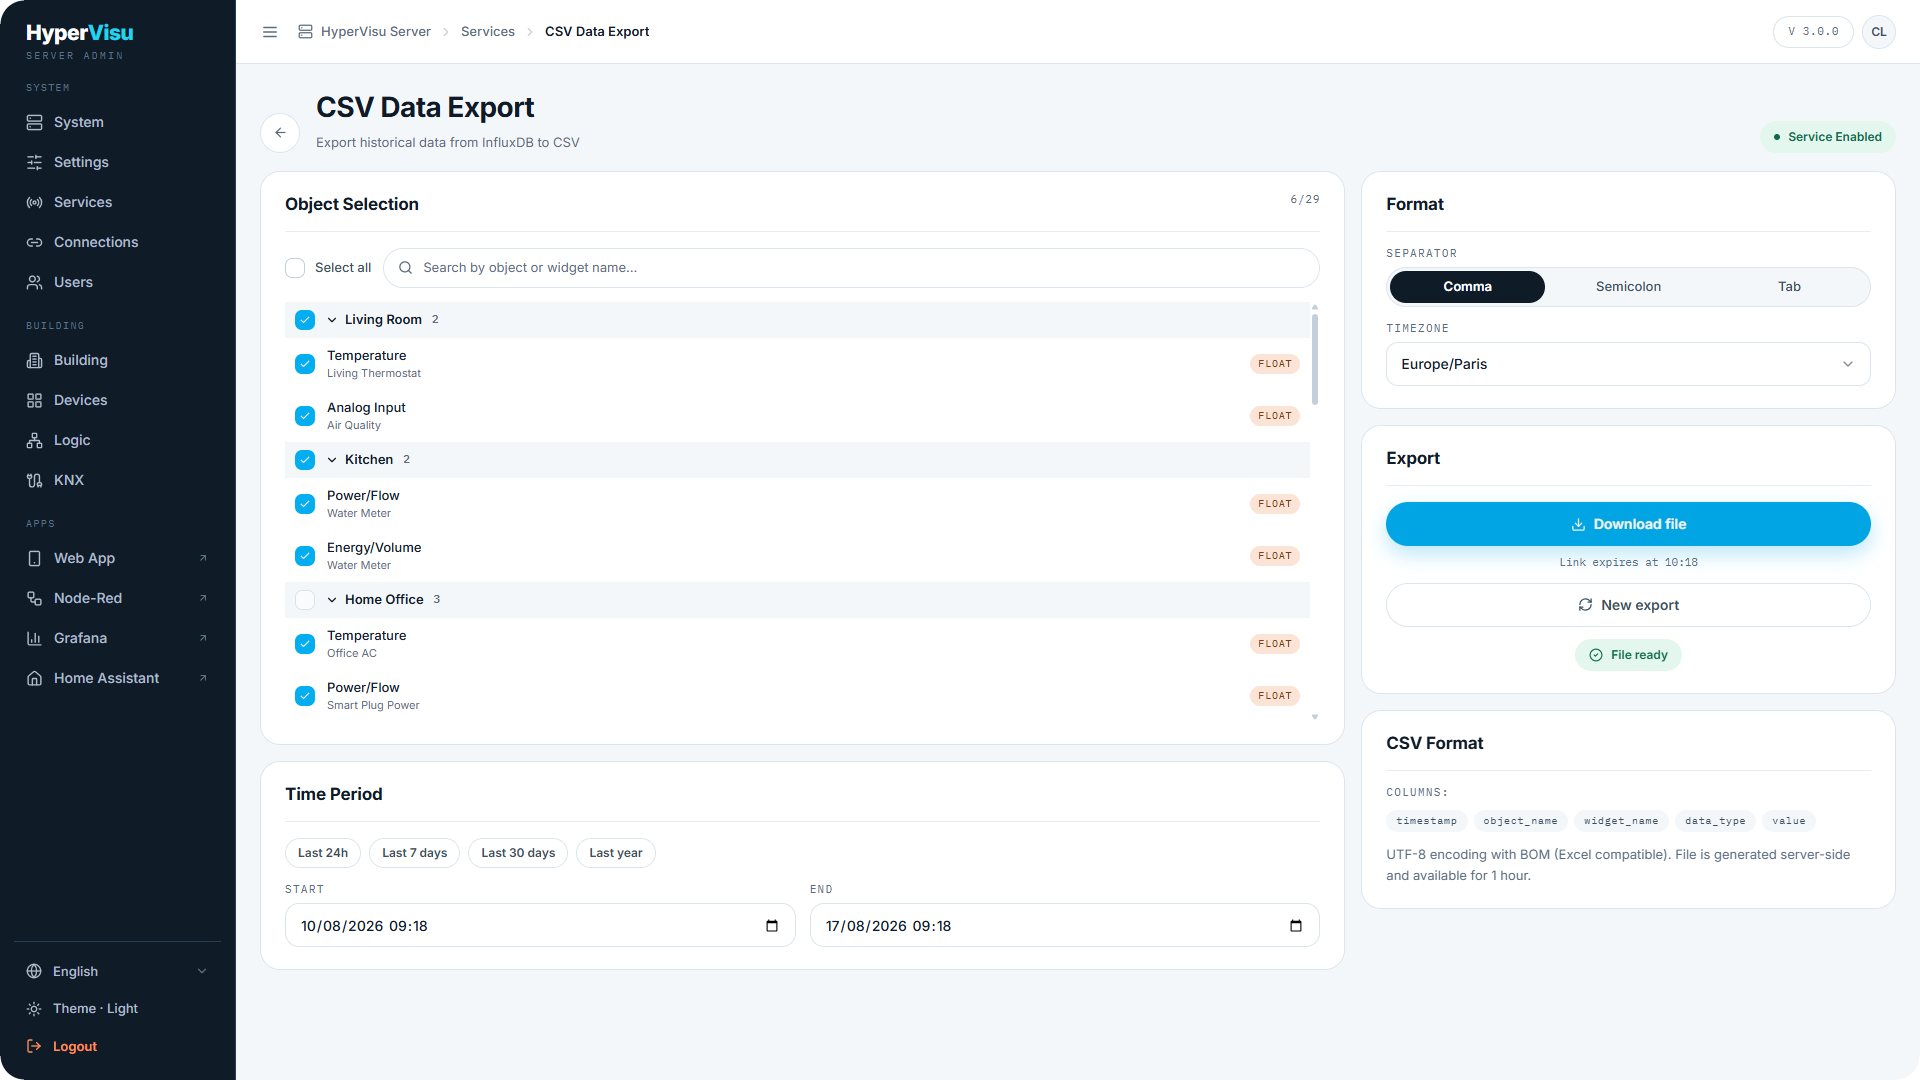
The CSV Export page (sidebar) turns logged history into a spreadsheet-friendly file.
- In Object Selection, tick the objects to export. They are grouped by room; use the search box or Select all. If the list is empty, no objects have logging enabled yet — enable it first (see “Object Settings, Logging & Notifications”).
- In Time Period, set Start and End, or use a shortcut: Last 24h, Last 7 days, Last 30 days, Last year.
- In Format, choose the Separator (Comma, Semicolon or Tab) and the Timezone for the timestamps.
- Click Export CSV. The file is generated on the server in the background — you can watch the progress.
- When it is ready, click Download file.
📘 Note: The download link is valid for 1 hour; after that, start a new export. The file is UTF-8 with BOM, so it opens correctly in Excel.
Device activity log
Separate from the history database, the server also keeps a per-device activity log: every command sent to a device and every state change it reports, with its origin — the resident and the client they used, the scenario, automation, Logic function, schedule, group, KNX bridge or webhook that caused it — and whether the device confirmed the command. It opens from the Activity button on each device row, and its recording and retention settings live on the Services → Device Activity Log page. Both are described in “Device Activity Log”.