Bus monitor
The Bus monitor tab shows decoded KNX telegrams from the bus — your first diagnostic stop when a device does not react.
What you need: the history database service enabled (see “History & Data Logging”). Without it the tab shows a notice instead of data.
Each telegram row shows the source address, destination address, data type (DPT), raw data, and — where the address is known — the group address name, the bound device, the object and its room.
- Filter by time: set Start Date/Time and End Date/Time to inspect a period (last night's heating cycle, yesterday's alarm event).
- Search: free-text search across addresses and names — combined with the jump from a group address (see “KNX Integration”) this isolates one address's traffic.
- Paging: results are paged with a record count and First / Previous / Next / Last controls.
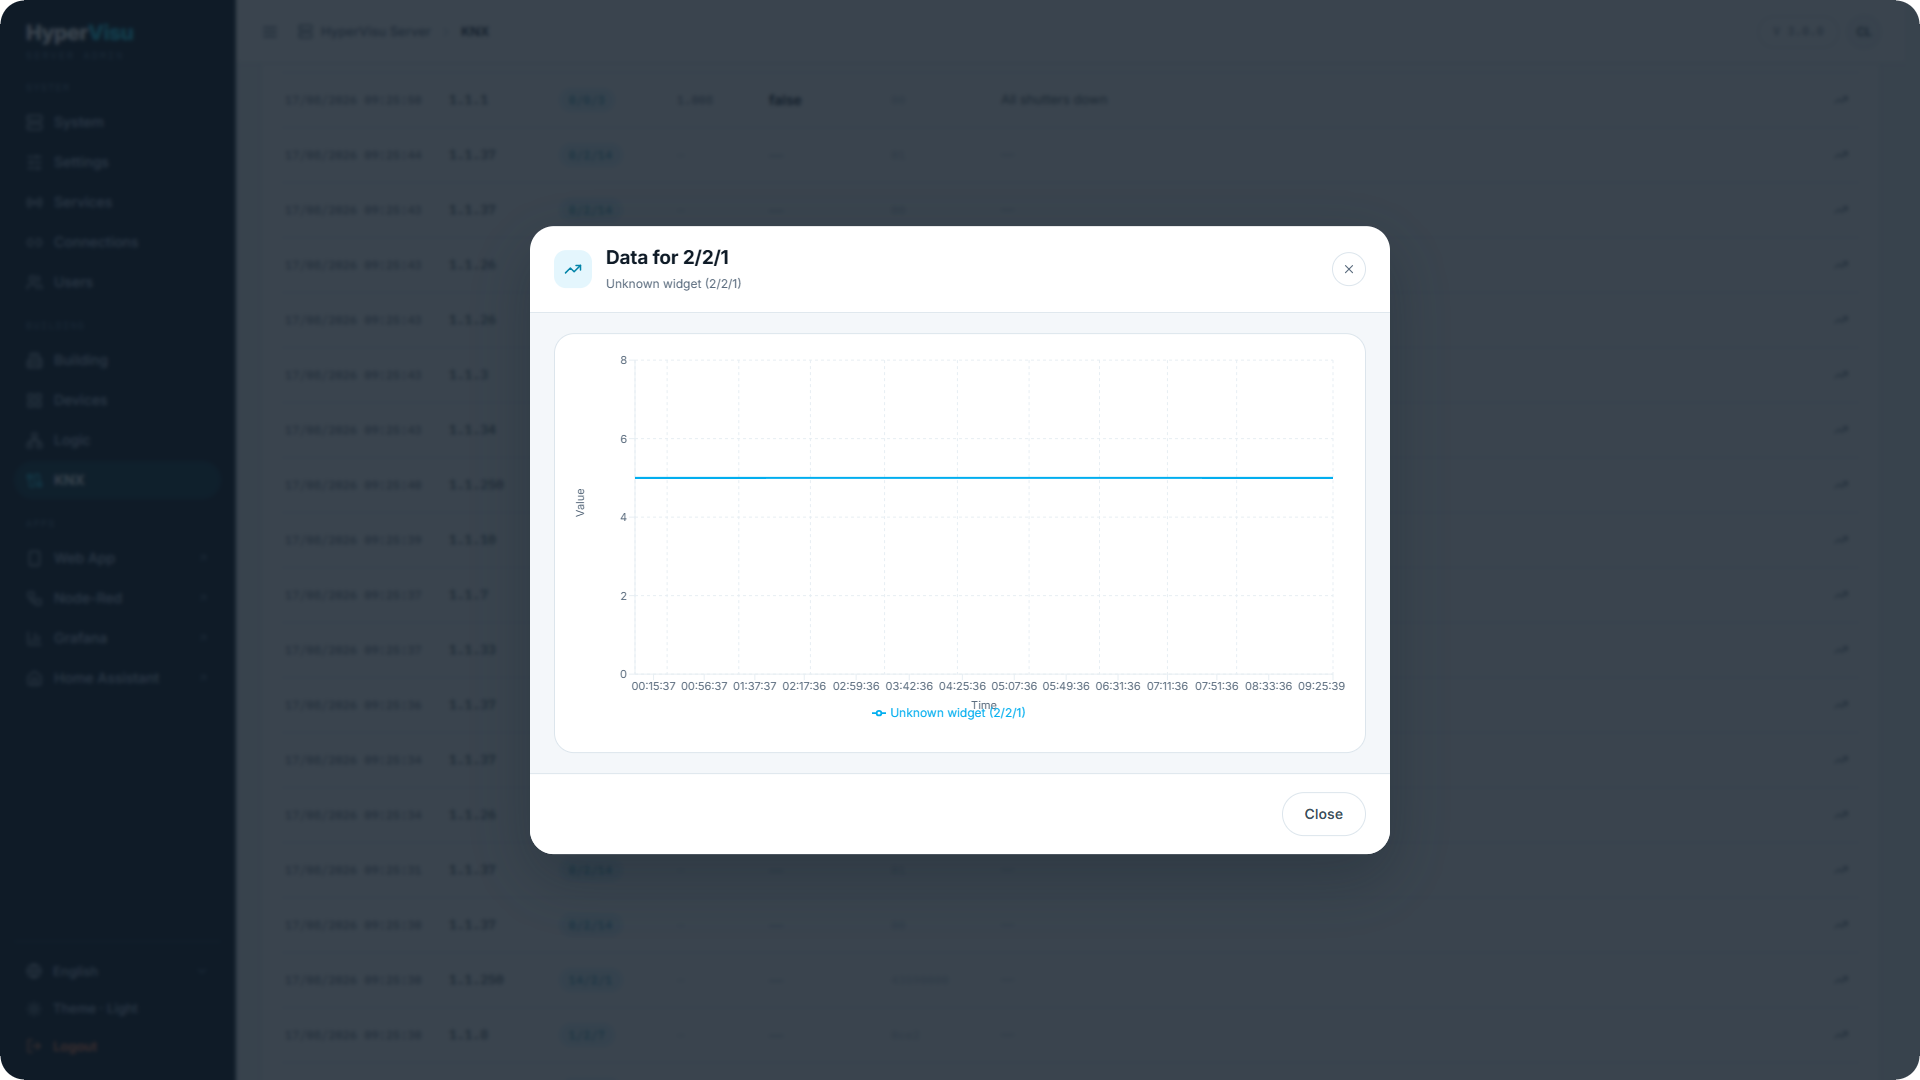
- Chart: click Show chart on a numeric address to plot its values over the selected period.